India

Monsoons: Wet, Dry, Repeat
Credit: NASA/Goddard/Ryan Fitzgibbons This video is public domain and along with other supporting visualizations can be downloaded from the Scientific Visualization Studio The monsoon is a seasonal rain and wind pattern that occurs over South Asia (among other places). Through NASA satellites and models we can see the monsoon patterns like never before. Monsoon rains provide important reservoirs of water that sustain human activities like agriculture and supports the natural environment through replenishment of aquifers. However, too much rainfall routinely causes disasters in the region...

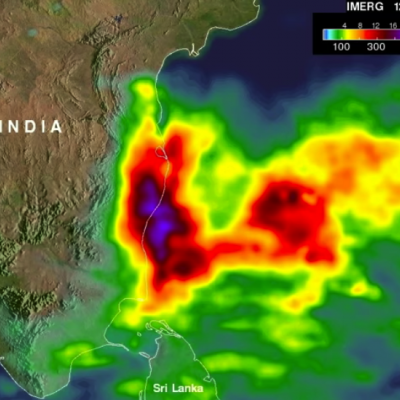
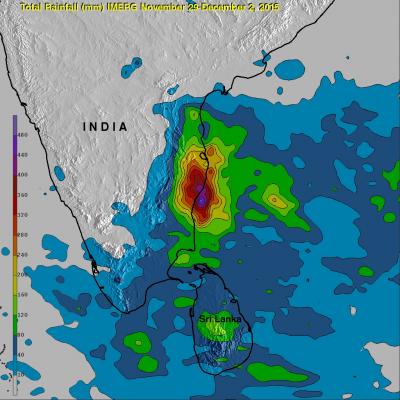
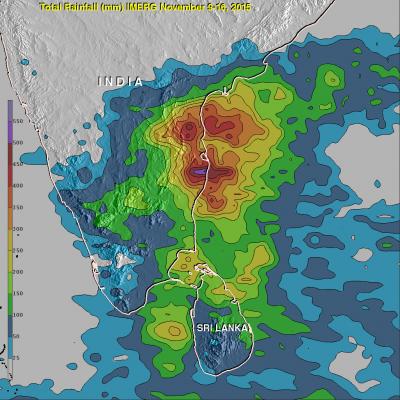
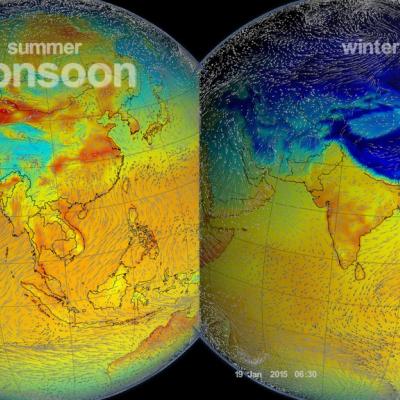
IMERG Sees Onset Of Possibly Wetter India Monsoon

On June 8 the nodal weather agency of India (IMD) declared the arrival of the 2016 Southwest Monsoon over the Indian state of Kerala. This season is expected to be rainier than recent years. The El Nino conditions which have been blamed for recent disappointing monsoons has weakened to ENSO-neutral conditions. ENSO-neutral conditions are expected to transition to La Nina in the northern hemisphere by the fall and winter of 2016-17. La Nina conditions normally result in beneficial wetter and cooler monsoons in India. An animation of weekly rainfall totals was derived from NASA's Integrated

NASA's IMERG Adds Up More of Southern India's Extreme Rainfall

Data from the Global Precipitation Measurement or GPM mission core satellite were used to help estimate rainfall data. GPM is a satellite co-managed by both NASA and the Japan Aerospace Exploration Agency. The city of Chennai on India's southeastern coast was hit particularly hard. More than 260 deaths have been reported in the Indian state of Tamil Nadu. Data from NASA's Integrated Multi-satellitE Retrievals for GPM (IMERG) were used to estimate the flooding rainfall that fell from November 28 to Dec. 4, 2015. Over 400 mm (15.7 inches) of rainfall were estimated over areas south of Chennai

Southern India's Catastrophic Flooding Analyzed By IMERG

Extremely heavy rainfall over southeastern India caused deadly flooding in the middle of the month of November. Record setting rainfall has again caused deadly flooding in southern India. The latest deluge started at the end of November 2015 and generated flooding that has resulted in the reported deaths of 188 people. NASA's Integrated Multi-satellite Retrievals for GPM (IMERG) combines all data from 12 satellites into a continuously updated global map of rainfall at half hourly intervals. The rainfall accumulation analysis above was computed from data generated by IMERG during the period

India's Deadly Flooding Rains Measured By IMERG

During the past week extreme rainfall from two unnamed slow moving tropical lows has causing severe flooding in southern India. This flooding has caused the reported deaths of as many as 71 people. The city of Chennai in the state of Tamil Nadu has been hit exceptionally hard with 59 people people killed. NASA's Integrated Multi-satellite Retrievals for GPM (IMERG) combines all data from 12 satellites into a global map of rainfall at half hourly intervals. The rainfall accumulation analysis above was computed from data generated by IMERG during the past week from November 9-16, 2015. An
Using NASA Data to Show How Raindrops Could Save Rupees
Rainwater could save people in India a bucket of money, according to a new study by scientists looking at NASA satellite data. The study, partially funded by NASA’s Precipitation Measurement Missions, found that collecting rainwater for vegetable irrigation could reduce water bills, increase caloric intake and even provide a second source of income for people in India. The study, published in the June issue of Urban Water Journal, is based on precipitation data from the Tropical Rainfall Measuring Mission (TRMM), a joint mission between NASA and the Japan Aerospace Exploration Agency, which...

India's Monsoon Starts

Monsoon rainfall, although a little later than normal, has started in southern India. Due to El Nino conditions India's monsoon is predicted to bring below normal rainfall this year. Cooling rainfall comes to the country after high temperatures preceding the monsoon have caused the reported deaths of over 2300 people. Data from the NASA's Integrated Multi-satellitE Retrievals for GPM (IMERG) was used in this animation to show the advent of India's monsoon. Rainfall estimates for the past few days (4-5 June 2015) show that some heavy showers have dropped over 120mm (4.7 inches) of rain in the

TRMM Sees Intensifying Cyclone Hudhud

The TRMM satellite flew over intensifying cyclone Hudhud in the Bay Of Bengal on October 10, 2014 at 0945 UTC.A Rainfall analysis from TRMM's Microwave Imager (TMI) instrument and Hudud's track is shown here. Cyclone Hudhud's is predicted to become a powerful category three tropical cyclone (on the Saffir-Simpson hurricane scale) with sustained winds peaking at 100 kts (115 mph) before hitting India's east coast in a couple days.

TRMM Again Examines Energetic 92B

The tropical disturbance (92B) in the Bay Of Bengal was raining heavily when the TRMM satellite flew almost directly above on May 21, 2014 at 0051 UTC. TRMM's Precipitation Radar (PR) revealed that rain was falling at the extreme rate of over 191 mm/hr (about 7.5 inches) in powerful convective storms in the center of the Bay Of Bengal well to the east of India. TRMM's Precipitation Radar data were also used to construct this simulated 3-D view, looking toward the east from India, of 92B's rainfall structure. TRMM PR pulled away a veil of clouds and revealed that some powerful convective storm

TRMM Sees Stormy Bay Of Bengal

On May 19, 2014 at 1056 UTC TRMM flew over a tropical low (92B) in the Bay Of Bengal east of India. TRMM's Precipitation Radar (PR) instrument found that rain was falling at a rate of over 138 mm/hr (about 5.4 inches) in some strong convective storms. A rainfall analysis from TRMM's Microwave Imager (TMI) and Precipitation Radar (PR) data is shown overlaid on a METEOSAT-7 visible/infrared image captured at 1100 UTC . TRMM PR data were also used in this 3-D image that shows a simulated view of the tropical disturbance's rainfall structure. Tall storms were shown reaching heights of over 14km