GPM Applications: Weather

Using GPM Data for Weather, Climate, and Land Surface Modeling

Using GPM Data for Weather, Climate, and Land Surface Modeling

Variations in rain, snow, and other forms of precipitation are an integral part in everyday weather and long term climate trends. Initialization of short-term weather and long-term climate models with accurate precipitation information enhances their prediction skills and extends their skillful lead times. To get the resolution and temporal coverage to measure precipitation across the globe, we often rely on satellite information. Satellite data can play a fundamental role in our ability to monitor and predict weather systems as well as to forecast future changes to our climate and land surface. Satellite data from GPM’s suite of precipitation products are integrated into numerical weather prediction models that are operated by operational partners to provide and improve the observations from which the forecasts are then generated. Similarly, climate and land surface models use satellite precipitation observations from GPM to describe the conditions that exist today in order to project how conditions may change in the future. The Weather, Climate, and Land Surface Modeling applications area promotes the use of GPM data to help monitor existing weather activity and model future behavior of precipitation patterns and climate.

Overview

Variations in rain, snow, and other forms of precipitation are an integral part in everyday weather and long term climate trends. Initialization of short-term weather and long-term climate models with accurate precipitation information enhances their prediction skills and extends their skillful lead times. To get the resolution and temporal coverage to measure precipitation across the globe, we often rely on satellite information. Satellite data can play a fundamental role in our ability to monitor and predict weather systems as well as to forecast future changes to our climate and land surface. Satellite data from GPM’s suite of precipitation products are integrated into numerical weather prediction models that are operated by operational partners to provide and improve the observations from which the forecasts are then generated. Similarly, climate and land surface models use satellite precipitation observations from GPM to describe the conditions that exist today in order to project how conditions may change in the future. The Weather, Climate, and Land Surface Modeling applications area promotes the use of GPM data to help monitor existing weather activity and model future behavior of precipitation patterns and climate.

Sections

GPM Data for Decision Making

Image

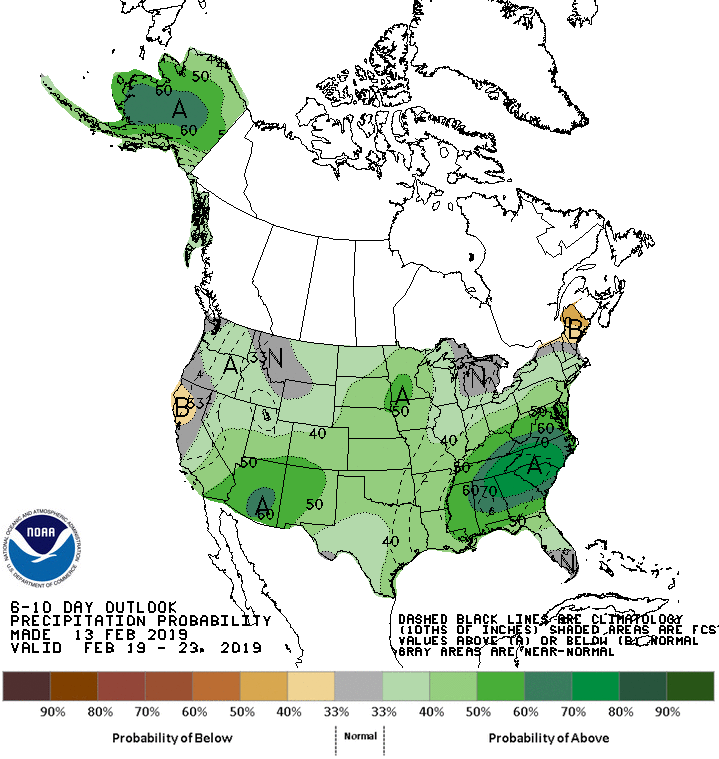
NOAA’s Climate Prediction Center (CPC) issues extended range outlook maps for 6-10 days in the future. The above figure shows a 6-10 forecast of precipitation probability for the first week of October 2018. This product complements short-range weather forecasts issued by other components of the National Weather Service. Credit: NOAA/NCEP/CPC
 

Numerical weather prediction (NWP) is the use of computer models to predict upcoming weather. Specifically, NWP centers rely on microwave-based satellite rainfall information, such as data retrieved from GPM’s GMI, to improve short- to long-term weather forecasts and correct track forecasts for tropical cyclones. In addition, NWP centers create precipitation products for “nowcasting” weather in the immediate 1-5 hours (e.g. using near-real-time rainfall data from GPM) to meet the needs of a wider user community, including weather forecasters, hydrologists, farmers, numerical modelers, the military and the climate community. Methods for integrating rainfall data are constantly evolving and advancing, and with GPM’s advanced instruments, scientists can influence and enhance their scientific research and benefit socioeconomic activities.

Image

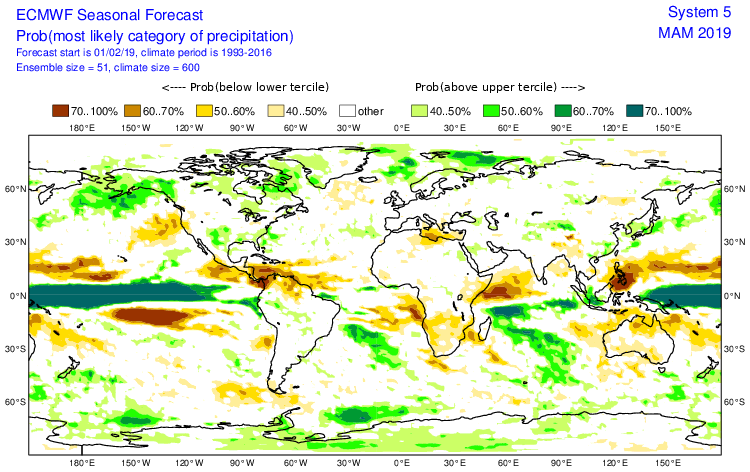
European Centre for Medium-Range Weather Forecast (ECMWF) Seasonal Forecast of precipitation probability. Percent probability is determined by using the predictive anomaly relative to 24 years of observed precipitation from 1993-2016. Credit: European Centre for Medium-Range Weather Forecast
 

To understand the changing climate and make future climate predictions, scientists need to use sophisticated computer models to recreate Earth’s climate conditions. Understanding current rainfall and snowfall variability, among other climate factors on regional and global scales, helps scientists model future behavior of precipitation patterns and climate. But for a system as complicated as the Earth, the models are only as good as the data provided. Satellite precipitation measurements from GPM and its predecessor TRMM provide global scale observational data sets that are comprehensive and consistent over long time periods, two characteristics scientists need to understand the relationships between different parts of the climate system. Specifically, organizations use GPM and TRMM data as input to verify and validate their seasonal and climate model simulations. The ultimate goal is to be able to predict changes in climate on time scales as short as the next hurricane season and as far into the future as changes that may occur in the coming decades or centuries. 

Image

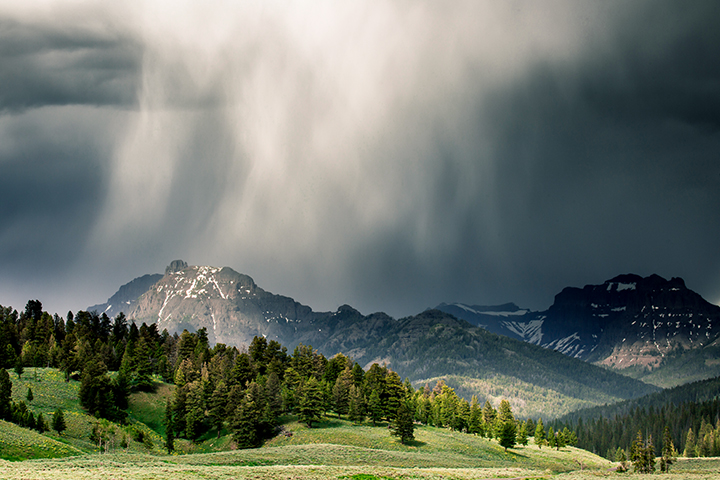
Climate change may lead to an increase in temperatures and a decrease in snowpack within the Absaroka Range, found at the eastern edge of Yellowstone National Park. Credit: National Park Service/Neal Herbert
 

Precipitation is the fundamental driver of land surface hydrological processes and a key component of the terrestrial water cycle, which in turn affects the functioning of atmospheric and climate processes. High-resolution modeling of land surface hydrological processes requires detailed rainfall estimates as inputs to improve understanding of the state of the water cycle and impacts on land-surface processes during extreme events. Satellite precipitation data from GPM is integrated into land surface models to study surface features and how they change due to manmade and natural conditions such as urbanization and erosion. The use of GPM precipitation data together with other satellite data including soil moisture within land surface models will improve weather and hydrological prediction, which will help city planners and even decision makers save lives. 

Weather & Climate Featured Resources

Jump to a Year

2022 | 2021 | 2020 | 2019 | 2018

2017 | 2016 | 2015 | 2014 | 2013

2012 | 2011 | 2010 | 2009 | 2008

2007 | 2006 | 2005 | 2004 | 2003

2002

Screenshot of the IMERG animation showing rainfall totals from the atmospheric river in Jan. and Feb. 2024.
A pair of powerful atmospheric river events brought heavy precipitation across much of coastal California this week, resulting in record rainfall totals, extensive flooding, numerous landslides, hurricane-force winds, and power outages. These types of atmospheric river events that impact the U.S. West Coast are also known as the “Pineapple Express” due to their transport of moisture up from the Tropics originating around Hawaii. The first event had the greatest impact on northern and central California. It was initiated when a large low-pressure trough located in the northeast Pacific
jasper-screenshot.png
In mid-December 2023, the far north region of Australia’s Queensland state experienced heavy precipitation and flooding as a result of Tropical Cyclone Jasper, which made landfall on December 13 north of the town of Port Douglas. The Joint Typhoon Warning Center began issuing bulletins on Jasper on December 5 as it developed into a tropical depression over the Western South Pacific Ocean. By December 7, Jasper had strengthened to a Category 4-equivalent cyclone on the Saffir-Simpson scale as it tracked southwestward. By the time it made landfall on December 13, Jasper’s winds had weakened back
GPM Overpass of Hurricane Otis
After rapidly intensifying overnight, Hurricane Otis made landfall near Acapulco, Mexico around 1:25 a.m. CDT (06:25 UTC) on Wednesday Oct. 25 as a powerful Category 5 hurricane. Otis had maximum sustained winds estimated at 165 mph by the National Hurricane Center (NHC), making it the first Category 5 as well as the most powerful storm to hit the Pacific coast of Mexico on record. Otis formed into a tropical depression (TD 18-E) on the morning of Sunday Oct. 22 about 530 miles (850 km) south-southeast of Acapulco from a broad area of low pressure. The depression was moving slowly northward
GPM Overpass of Cyclone Bolaven
Typhoon Bolaven began as a tropical depression over the West Pacific Ocean on Oct. 7, 2023. On Oct. 10, Bolaven became a Typhoon and passed over the Mariana Islands as it tracked to the northwest. Bolaven then rapidly intensified over 12 hours from a Category 1 to a Category 5 storm on the Saffir-Simpson scale, starting around 12 UTC on Oct. 10. Several factors contributed to the rapid intensification, including modest shear in the atmosphere and warm sea-surface temperatures. This animation shows precipitation within Typhoon Bolaven around the time that rapid intensification began. The global
Map of IMERG precipitation estimates from recent flooding rainfall in Greece.
On Sept. 4, 2023, a low-pressure system developed over southeastern Europe that would lead to devastating floods over Greece and other parts of the region. The system was given the name “Daniel” by local meteorological agencies. Daniel was dynamically driven by strong cyclonic flow in the upper-level winds over southeastern Europe. The upper-levels winds combined with low-level winds from the northeast which supplied moisture from the unusually warm waters of the Aegean and Black Seas to central Greece. According to satellite infrared and microwave estimates from NASA's MUR and NOAA’s OISST v2
Screenshot of the IMERG animation showing rainfall totals from the atmospheric river in Jan. and Feb. 2024.
A pair of powerful atmospheric river events brought heavy precipitation across much of coastal California this week, resulting in record rainfall totals, extensive flooding, numerous landslides, hurricane-force winds, and power outages. These types of atmospheric river events that impact the U.S. West Coast are also known as the “Pineapple Express” due to their transport of moisture up from the Tropics originating around Hawaii. The first event had the greatest impact on northern and central California. It was initiated when a large low-pressure trough located in the northeast Pacific
Map of IMERG precipitation estimates from recent flooding rainfall in Greece.
On Sept. 4, 2023, a low-pressure system developed over southeastern Europe that would lead to devastating floods over Greece and other parts of the region. The system was given the name “Daniel” by local meteorological agencies. Daniel was dynamically driven by strong cyclonic flow in the upper-level winds over southeastern Europe. The upper-levels winds combined with low-level winds from the northeast which supplied moisture from the unusually warm waters of the Aegean and Black Seas to central Greece. According to satellite infrared and microwave estimates from NASA's MUR and NOAA’s OISST v2
IMERG Precipitation Anomalies
Rain gauges are plentiful around the United States, but that’s not the case elsewhere in the world – particularly over oceans and sparsely populated areas. That means scientists and other data users have to rely on satellite measurements – such as those provided by NASA’s Global Precipitation Measurement (GPM) mission – to fill in the gaps. The list of data users now includes the U.S. Air Force’s 557th Weather Wing. For the first time, the Air Force meteorology unit has integrated the Integrated Multi-satellite Retrievals for GPM (IMERG) algorithm into its operational weather forecasts and
Screenshot of the High-Impact Weather Assessment Toolkit (HIWAT),
Bangladesh has a long history of deadly and costly storms. Because these storms are so localized, they can be notoriously difficult to forecast, especially without access to the most advanced weather prediction technology. Researchers have created a new tool to boost the country’s ability to forecast severe weather. The SERVIR program - a joint initiative of NASA, USAID, and leading geospatial organizations in Asia, Africa, and Latin America - and the Bangladesh Meteorological Department ( BMD ) recently launched the High-Impact Weather Assessment Toolkit ( HIWAT ), a web-based tool that
IMERG rainfall totals in South Africa, April 5 - 18, 2022.
An upper-level area of low pressure tapped into the warm waters of the South Indian Ocean to bring heavy rains and flooding to parts of South Africa during the second week of April. The event unfolded when an upper-level trough of low pressure embedded within the midlatitude westerlies traversed the southern part of Africa from west to east. As the trough approached the east coast of South Africa, an area of low pressure became detached from the main flow, this “cut off” low then drifted over the warm waters of the Agulhas Current, which channels warmer waters from the tropical Indian Ocean
IMERG Rainfall Totals from Australian :"Rain Bomb" in March 2022
The below animation shows surface rainfall estimates from NASA’s IMERG multi-satellite precipitation product for the week starting on Feb. 22, 2022 at 0000 UTC and ending on Feb. 28, 2022 at 2330 UTC. Areas shaded in blue and yellow show three-hour average snapshots of IMERG rain rates every half-hour overlaid on cloudiness (shown in white/gray) based on geosynchronous satellite infrared observations. Below the rain rates and cloudiness data, IMERG rainfall accumulations are shown in green and purple. Tropical Cyclone Anika’s track is shown with a gray line based on data from the U.S. Navy-Air
IMERG rainfall totals from the Nov. 2021 atmospheric river.
The Pacific Northwest coast saw two atmospheric rivers (ARs) bring heavy rains from Nov. 10-16, 2021, resulting in severe flooding, landslides, and damage to infrastructure in the British Columbia province of Canada. ARs are long, narrow corridors of water vapor that travel vast distances above the ocean from warm, tropical regions to higher latitudes, where they often release their moisture as rainfall when they reach land areas. While ARs occur across the globe, this year has been notable for several strong events that have impacted the Pacific Northwest coast. The two atmospheric rivers in
2021 average daily rainfall June, July August.
The Indian summer monsoon, also known as the southwest monsoon, falls within the South Asian monsoon and is the strongest and perhaps best-known of the world’s monsoons. During summer months when the Asian landmass heats up, warm, moist air flows northward from the Indian Ocean towards the Himalayas, bringing abundant showers and thundershowers to India. The summer monsoon is a regular event that occurs every year and is responsible for roughly 80% of India’s annual rainfall. The summer monsoon typically starts in early June, peaks in July and August and winds down during September and early
IMERG rainfall totals from recent atmospheric river.
The Pacific Northwest experienced a memorable series of storms in late Oct. 2021 as several low-pressure systems rolled in from the northeast Pacific Ocean. One of the systems was classified by meteorologists as a “bomb cyclone”, meaning that its central pressure (an indication of storm strength) had dropped particularly rapidly in a short time period. At its minimum pressure (highest strength), the system was reported by the National Weather Service to have had the lowest pressure of a system over the northeastern Pacific Ocean since reliable observations began in 1974. The system was notable
Hurricane Ida IMERG Totals
All eyes were on Hurricane Ida as it made landfall in Louisiana on Aug. 29, 2021, but many people were taken by surprise by the power of Hurricane Ida's remnants when they reached Virginia during the day on Sept.1 and New York City late at night on Sept. 1 into early morning on Sept. 2. The below animation shows the precipitation that fell during the entire lifecycle of Ida from before landfall in Louisiana through the impacts on New York City. Download this video (right-click -> "Save As") This animation uses data from the near real-time version of NASA's IMERG algorithm, a data product that
IMERG Precipitation Anomalies
Climate change impacts all of us in various ways. Changes in soil moisture have a pronounced effect on agricultural production, which in turn impacts the food we grow to eat. Changes in precipitation patterns are leading to increases in drought in certain regions and causing flooding in others. All of these impacts are influenced by interactions among processes within the Earth system involving the atmosphere, ocean, land, ice, and life. These natural interactions, combined with human influences such as the release of greenhouse gases, serve to drive the climate system resulting in distinct
GOES Model of Earth's Climate
Climate researchers around the world are taking advantage of NASA satellite observations to help inform, improve, and enhance climate models. NASA data helps to predict the future of Earth's climate and improve the predictive capability of models. This gives decision-makers the tools they need to make better decisions on how we live, including understand the changing impacts of hurricanes and improving predictions of fire seasons. But how exactly does NASA data support climate modeling activities, and how does the data improve these models? We’re here to explain the inner workings of how NASA
GPM Overpass of Tropical Cyclone Fred on August 16, 2021.
Tropical Storm Fred, the 6th named storm of the 2021 Atlantic hurricane season, began as a westward moving disturbance in the central Atlantic east of the Lesser Antilles. The system passed through the southern Leeward Islands during the early morning hours of August 10 but still lacked a well-defined center of circulation. Despite significant thunderstorm activity within the system, it wasn’t until late that evening, when the system was passing just south of Puerto Rico, that the National Hurricane Center (NHC) identified a well-defined circulation and upgraded the system to Tropical Storm
IMERG precipitation over China for July 17 to 28, 2021
During July 17 to 28, 2021, several storm systems brought heavy rain to parts of China and surrounding countries, while a nine-month-long drought persists in an adjacent part of China. NASA's multi-satellite precipitation algorithm has been monitoring this rainfall in near real-time, and the estimates are distributed to weather-forecasting agencies and disaster-monitoring organizations. This algorithm is called IMERG , the Integrated Multi-satellitE Retrievals for GPM. GPM is the NASA / JAXA Global Precipitation Measurement mission , which launched its Core Observatory satellite in 2014. Two
IMERG analysis of monsoon rainfall in India, July 2021
After a relatively quiet period of below normal activity that began in the latter part of June and extended into the first half of July, and which resulted in rainfall deficits over much of India, the South Asian monsoon surged to life last week, bringing heavy rains, widespread flooding and landslides. Among the hardest hit areas was the western state of Maharashtra, which extends from the central west coast of India inland. A key geographical feature along the west coast of India is the Western Ghats. This coastal mountain range runs roughly north-south for about 1000 miles along the west
IMERG Precipitation Totals from Eastern Australia, March 16 - 23, 2021
During the week ending on March 23, 2021, two locations in Australia experienced unusually high rainfall totals. According to news reports a persistent system brought flooding rains to Australia's east coast from Brisbane to Sydney and points further south. The preliminary estimate from NASA's multi-satellite global precipitation analysis is that more than 24 inches fell just off the coast of Australia in 7 days with accumulations in coastal areas exceeding 16 inches. Near the Strzelecki Desert in central Australia, a storm system brought 8 inches of precipitation during the same 7-day period. Most of the rain fell during a 3-day period (0000 UTC on 20 March to 2359 UTC on 22 March).
IMERG Sees Winter Storms Impact the Southern U.S.
In mid-February 2021, large areas of the Continental United States experienced extreme cold temperatures as a result of a strong Arctic high pressure system. The cold temperatures were accompanied by several pulses of precipitation over the Southeast US through the mid-Atlantic, as well as the Pacific Northwest. The combination of cold temperatures and precipitation resulted in widespread power outages to millions of people in Texas, Kentucky, West Virginia, and Oregon, among other states.
IMERG Rainfall Total from Week of Jan 25 2021
NASA combined data from multiple satellites to estimate the rainfall from an "atmospheric river" event over the U.S. West Coast in near real-time at half-hourly intervals from January 25 - 29, 2021. Atmospheric rivers are long, narrow corridors of water vapor that can lead to heavy precipitation when they encounter land. This animation shows estimated rainfall rates in blue and yellow shading and total rainfall accumulations in green shading, from NASA's IMERG algorithm, overlaid on shades of white and gray from NOAA infrared satellite data which shows cloudiness. On January 25, 2021, a low
IMERG Rainfall Totals from Medicane Ianos
From September 14th - 20th, 2020, NASA’s IMERG algorithm estimated the rainfall from a Mediterranean cyclone with tropical-like characteristics, commonly known as a “Medicane”, which flooded parts of Greece. Medicanes typically appear once or twice a year and are similar to tropical storms in that both have a symmetric structure, a warm core, a clearly visible eye, and winds of at least tropical-storm strength. This particular storm system, dubbed "Ianos" by the National Observatory of Athens, led to media reports of flooding throughout the islands of Kefalonia and Zakynthos off the western
IMERG totals from hurricane sally
The northern Gulf Coast has seen its share of storms this busy hurricane season. At the end of August, then Tropical Storm Marco brought heavy rains to parts of the Florida Panhandle while western Louisiana took a direct hit from the much more powerful Category 4 Hurricane Laura. Now, just over 3 weeks since Laura made landfall, the northern Gulf Coast was struck again, this time by Hurricane Sally. Though not as powerful as Laura, the still rather strong Sally behaved more like Marco. But, while Marco was largely sheared apart with most of the rain well northeast of the center as it slowed
IMERG Rainfall from Typhoons Bavi, Maysak and Haishen
From August 22 through September 7, 2020, NASA’s IMERG algorithm estimated rainfall from three typhoons as they passed over the Pacific Ocean, Japan, and Korea. According to NOAA's records, this was the only time since records have been kept starting in 1945 that the Korean peninsula saw three landfalling typhoons in a single year, let alone in two weeks. Each of the three typhoons--Bavi, Maysak, and Haishen--reached the equivalent of “major hurricane” status, meaning Category 3 or above on the Saffir-Simpson hurricane-intensity scale (shown here as a red in the hurricane track) along their
IMERG rainfall from the Pakistan Floods 2020
In the last week of August 2020, Pakistan's largest city, Karachi, received over 8 inches of rainfall according to NASA's IMERG dataset, causing destructive flooding in the region. The amount of rain that fell that week is roughly equivalent to the amount that Karachi typically receives in an entire year, based on IMERG's 19-year global climatology. In a typical year, most of Karachi's rain will fall in July and August, but the rainfall during the week of August 23rd was unusually heavy. The top panel of the three panels in this image shows the depth of the 7-day rainfall accumulation in
IMERG Rainfall Totals from Hurricanes Marco and Laura
The northern Gulf Coast, specifically Louisiana, saw two tropical cyclones make landfall in the same week just days apart. The two systems, however, could not have been more different when they arrived. Despite forming a day later, Marco was the first system to make landfall on the Gulf Coast. Marco originated from a tropical easterly wave that was moving from the central to the western Caribbean. After becoming a tropical depression (TD) on the 20th of August, TD #14 turned northwestward the following day as it approached the coast of Central America and moved into the northwest Caribbean
GPM Overpass of Hurricane Laura 8/27/20
After crossing western Cuba, Tropical Storm Laura emerged into the Gulf of Mexico where warm water, low wind shear and a moist environment made conditions ideal for intensification. As it made its way through the Gulf of Mexico Laura strengthened - from a category 1 hurricane with sustained winds of 75 mph on the morning of Tuesday August 25th, to a powerful category 4 storm, with sustained winds of 150 mph on the evening of Wednesday August 26th - an increase of 75 mph in just 36 hours. At this point Laura was nearing the coast of western Louisiana, and made landfall near Cameron, Louisiana
GPM Overpass of Hurricane Laura 8/26/20 10:00pm CT
Hurricane Laura began as a tropical depression on August 21st near the U.S. Virgin Islands, and over the next several days rapidly intensified to a dangerous category 4 hurricane at it moved towards the U.S. Gulf Coast. Laura made landfall as strong category 4 hurricane near Cameron, Louisiana shortly after midnight on August 27, 2020, bringing extreme rainfall, storm surge, and winds up to 150 mph. The NASA / JAXA GPM Core Observatory satellite flew over Hurricane Laura shortly before it made landfall at 10:00pm CT on Wednesday, August 26th, then again at 7:42am CT on Thursday, August 27th
Hurricane Laura on August 27, 2020
Update on August 28, 2020: During its approach to Louisiana, Hurricane Laura dramatically intensified from Category 2 to 4 (105 mph to 150 mph) between at 1AM and 7PM Central Time (CDT) on August 26, 2020. In the updated movie below, the precipitation falling from Laura is shown through 10:30PM CDT, August 27, as estimated by NASA's IMERG algorithm. To open the animation in a separate window, click here . On August 26, Laura became the first North Atlantic hurricane to reach "major hurricane" status this year, meaning that it reached category 3 on the Saffir-Simpson hurricane-intensity scale
Hurricane Isaias Impacts the US East Coast
From July 29 to August 5, 2020, NASA’s IMERG algorithm observed tropical storm Isaias’ rainfall over the Caribbean and large parts of the Eastern US. This animation shows the IMERG rain rates in green shading as Isaias tracked from the tropical Atlantic into the Caribbean, then northward along the Atlantic coast and into New England. The yellow line shows the location of Isaias' low-pressure center, as tracked by the National Hurricane Center and smoothed in time here for the animation.
IMERG Hurricane Hanna 7-27-20 cropped
Hanna formed from a westward propagating tropical easterly wave that entered the southeast corner of the Gulf of Mexico on Tuesday July 21st. The wave provided a focus for shower and thunderstorm activity, which then led to the formation of an area of low pressure over the central Gulf of Mexico. The National Hurricane Center (NHC) found that this low had developed a closed circulation by the evening of Wednesday July 22nd, making it Tropical Depression #8. Over the next 24 hours, the depression slowly organized and intensified over the central Gulf before reaching tropical storm intensity on
GPM Hurricane Douglas 7-25-20
Hurricane Douglas continued to approach the Hawaiian islands during this GPM overpass early in the morning (02:11 UTC) of July 25, 2020. Douglas had previously strengthened to a Category 4 hurricane the day before, but had substantially weakened over cooler waters throughout the day. Regardless, the GMI and DPR instruments recorded rain rates near 50 millimeters/hour (~2 inches/hour) near Douglas` center. The Central Pacific Hurricane Center advised residents of Hawaii to expect hurricane-strength winds and rainfall starting Saturday evening and lasting through Monday. View fullscreen in STORM
IMERG rainfall totals from Japan, July 3 - 9 2020
From July 3-9, 2020, NASA’s IMERG algorithm continued to observe the heavy precipitation that fell as part of the seasonal Meiyu-Baiu rains (“plum rains”) in east Asia. Weekly totals reached their regional maxima over the island of Kyushu in southern Japan. About half of the island of Kyushu received over 45 cm (~18 inches) of rain. The majority of Honshu, Japan’s main island, as well as Shikoku to its south, were also impacted by the rains, receiving from 10-25 cm, depending on the location. Additionally, large areas of eastern China were also covered by the plum rains during this weekly
IMERG rainfall totals from Japan, June 29 - July 5, 2020
This animation shows NASA IMERG rain rates (blue shading) and accumulations (green shading) near Kyushu island, in the southwest of Japan from June 29 - July 5, 2020. Devastating floods and landslides swept through parts of Kyushu on July 4, 2020, resulting in over 40 deaths and orders for hundreds of thousands of people to evacuate their homes according to media reports. Download video (right-click -> Save As) The rains that triggered the flooding occurred in the context of the Meiyu-Baiu rainy season, which arrives in east Asia every year from June to mid-July. “Meiyu” and “Baiu” are the
GPM Overpass of Hurricane Dorian
Tropical cyclones, known as hurricanes in the western hemisphere, can bring damaging high winds, storm surge, and flooding rainfall to the coastal communities they hit. Satellite instruments - and the detailed near real-time atmospheric data that they provide - have revolutionized the way we see hurricanes and other disasters as they happen. But it’s about more than just seeing. NASA, working with counterparts at NOAA, FEMA, and elsewhere are sharing ever more precise data to aid local communities in coping with disasters. With better information, emergency responders have the tools to make...
Cyclone Amphan IMERG Rainfall Totals
On May 16, 2020, NASA / JAXA's GPM Core Observatory satellite observed the early stages of Tropical Cyclone Amphan as it tracked north over the Bay of Bengal. The below GPM overpass shows precipitation within Cyclone Amphan a day before it explosively intensified into a category 4-equivalent cyclone. Even at this early stage, Amphan produced heavy rain rates near its center and to its west and southwest. View fullscreen in STORM Event Viewer NASA monitored the heavy rain associated with Tropical Cyclone Amphan as it made landfall at 0900 UTC (2:30 PM local time) on May 20, 2020. Landfall...
Typhoon Vongfong IMERG Rainfall Totals
The first typhoon of the season, Vongfong, struck the central Philippines this past week (where it is known as Ambo) as a strong category 2 storm, bringing strong winds and locally heavy rainfall. Vongfong formed into a tropical depression in the southern Philippine Sea west of Palau on Sunday May 10th from a disturbance that had been slowly making its way westward over the past several days. After becoming a depression, the system moved northward toward the central Philippine Sea and slowly began to intensify. Then, on the 12th when it reached tropical storm intensity, Vongfong’s northward...
Extratropical Storm Dennis, February 15, 2020
Storm Dennis is an extratropical cyclone that developed over the continental United States before undergoing explosive intensification as it crossed into the North Atlantic. On February 15 shortly after this GPM overpass, Dennis reached its minimum central pressure of 920 mb, which is reported to be the second-lowest on record for a North Atlantic winter storm. The eye can be seen south of Iceland, while rain bands to the south caused severe flooding across the British Isles. Text & Visualization by Jason West (NASA / KBR)
Typhoon Kammuri Hits the Central Phiippines
While the Atlantic hurricane season officially ended on November 30th, Typhoon Kammuri (known as Tisoy in the Philippines), which recently struck the central Philippines as a powerful Category 4 typhoon, is a reminder that the Pacific typhoon season is not yet over. In fact, while typhoon season does peak from around June through November, similar to the Atlantic, typhoons can occur throughout the year in the Pacific. Kammuri first formed into a tropical depression from an area of low pressure on the 25th of November north of Micronesia in the west central Pacific about 500 miles southeast of Guam.
Typhoon Hagibis Brings Heavy Rains to Japan
Typhoon Hagibis, a once powerful super typhoon, struck the main Japanese island of Honshu over the weekend, bringing very heavy rains and widespread flooding. Hagibis formed into a tropical storm on the 5th of October from a tropical depression that originated from a westward moving tropical wave north of the Marshall Islands. At first, Hagibis strengthened steadily becoming a typhoon about 24 hours after becoming a tropical storm. But, then on the 7th, Hagibis underwent a remarkable rapid intensification cycle and quickly intensified into a super typhoon with sustained winds estimated at 160 mph by the Joint Typhoon Warning Center (JTWC) less than 24 hours after becoming a minimal typhoon.
GPM observes Hurricane Dorian lashing Florida
Download in high resolution from the NASA Goddard Scientific Visualization Studio GPM captured Dorian at 10:41 UTC (6:41 am EDT) on the 4th of September when the storm was moving north-northwest parallel to the coast of Florida about 90 miles due east of Daytona Beach. Three days earlier, Dorian had struck the northern Bahamas as one of the most powerful Category 5 hurricanes on record in the Atlantic with sustained winds of 185 mph. Weakening steering currents allowed the powerful storm to ravage the northern Bahamas for 2 full days. During this time, Dorian began to weaken due to its...
GPM Observes Hurricane Dorian Over Bahamas
Download in high resolution from the NASA Goddard Scientific Visualization Studio. The NASA / JAXA Global Precipitation Measurement (GPM) Core Observatory flew over Hurricane Dorian on September 1st (5:22pm ET / 21:22 UTC) as the storm was directly over Abaco Island in The Bahamas. The satellite captured data on rainfall rates within the storm as it flew over using its Dual-frequency Precipitation Radar (DPR) and GPM Microwave Imager (GMI). In this animation the multi-satellite GPM IMERG product is shown first to illustrate rainfall rates prior to the overpass. When the camera zooms in data...
Hurricane Dorian Brings Heavy Rain to Bahamas
In addition to the powerful winds that have raked the northern Bahamas over the past few days, Hurricane Dorian’s slow motion has brought very heavy rainfall to the islands as well. Dorian first formed into a tropical depression on the 24th of August about 800 miles east southeast of Barbados in the Lesser Antilles from an area of low pressure; the depression was quickly upgraded to a minimal tropical storm and named Dorian by the National Hurricane Center (NHC) later in the day. As Dorian made its way westward under the influence of a high pressure ridge to the north, it was held in check...
IMERG Measures Rainfall in Hurricane Dorian
UPDATE 9/9/19: On Monday morning, September 9, Hurricane Dorian was a post-tropical storm after a mid-latitude weather front and cold seas had altered its tropical characteristics over the weekend. On Saturday and Sunday, Hurricane Dorian struck eastern Canada, causing wind damage and bringing heavy rainfall. According to the Associated Press, a peak of 400,000 people were without power in Nova Scotia, Canada, because of Dorian. This graphic shows precipitation that fell during the almost two-week period from August 27 to the early hours of September 9. The near-realtime rain estimates come...
5 Year Anniversary of Hurricane Arthur
TRMM overpass of Hurricane Arthur from July 3, 2014. View fullscreen in STORM Event Viewer June marks the official start of the Atlantic hurricane season. And although strong tropical cyclones are rare in June in the Atlantic, it will soon be the 5-year anniversary of Hurricane Arthur, which became a tropical depression in very late June 2014 before hitting the Outer Banks of North Carolina as a Category 2 hurricane in early July. As with most storms early in the season, Arthur formed not from a tropical wave moving off the coast of Africa but from an old frontal boundary that stalls off the...
GPM Catches Typhoon Yutu Making Landfall
NASA's GPM Core observatory satellite captured an image of Super Typhoon Yutu when it flew over the powerful storm just as the center was striking the central Northern Mariana Islands north of Guam. Early Thursday, Oct. 25 local time, Super Typhoon Yutu crossed over the U.S. commonwealth of the Northern Mariana Islands. It was the equivalent of a Category 5 hurricane. The National Weather Service in Guam said it was the strongest storm to hit any part of the U.S. this year. Download this video in high resolution from the NASA Goddard Scientific Visualization Studio Download video without...
Dive Into a 360-View of Hurricane Maria
Two days before Hurricane Maria devastated Puerto Rico, the NASA/JAXA Global Precipitation Measurement Core Observatory satellite captured a 3D view of the 2017 storm. At the time Maria was a category 1 hurricane. The 3-D view reveals the processes inside the hurricane that would fuel the storm’s intensification to a category 5 storm within 24 hours. For the first time in 360 degrees, this data visualization takes you inside the hurricane. The precipitation satellite has an advanced radar that measures both liquid and frozen water. The brightly colored dots show areas of rainfall, where green...
GPM Flies Over Tropical Cyclone Florence
Download in High Resolution from the NASA Goddard Scientific Visualization Studio GPM passed over Tropical Storm Florence on September 7, 2018. As the camera moves in on the storm, DPR's volumetric view of the storm is revealed. A slicing plane moves across the volume to display precipitation rates throughout the storm. Shades of green to red represent liquid precipitation. Frozen precipitation is shown in cyan and purple. NASA's Global Precipitation Measurement mission or GPM core observatory satellite flew over Tropical Storm Florence on September 7, 2018. At that time, the storm was...
GPM Sees Powerful Winter Storm Grayson
Powerful Coastal Storm Brings Snow, Extreme Cold, Wind and Blizzard Conditions to the East Coast View an interactive 3D visualization of GPM data from Winter Storm Grayson in STORM Event Viewer Mobile version Cold Artic air has been keeping the vast majority of the country east of the Rockies in the deep freeze over the past week. Now a powerful coastal storm is working its way up the East Coast bringing a mixture of snow, freezing rain, high winds and blizzard conditions from as far south as Florida all the way up into Maine with blizzard warnings in effect along the coast from North Carolina...
GPM Catches Nor'easter over New England
At the time of the Global Precipitation Measurement (GPM) Core Observatory overpass (April 1, 2017, 0550 UTC), the storm's center of low pressure was south of Long Island. At the mid-levels of the atmosphere, the circulation was centered over northeast Pennsylvania. This led to a classic overrunning, warm conveyor setup, which happened when the counterclockwise low level flow drew in cold air out of the north/northeast (hence "Nor'easter") from Canada. Higher up, warm and moist air from further south was lifted over this cold air and resulted in precipitation in the form of snow at the surface...
GPM Measures Tropical Cyclone Debbie
Tropical cyclone Debbie formed in the Coral Sea northeast of Australia om March 24, 2017. Debbie intensified and had hurricane force wind speeds within a day of formation. While headed toward northeastern Australia Debbie reached it's maximum sustained wind speeds estimated at over 100 kts (115 mph) on March 27, 2017 (UTC). Tropical cyclone Debbie came ashore on March 28th and brought destructive winds and extremely heavy rain to northeastern Australia. It was reported that heavy rainfall caused flash flooding that cut off a coastal town and covered several roads in Queensland. The GPM...
GPM Sees Hurricane Matthew Nearing Florida
UPDATE 10/6/16: NASA's Global Precipitation Measurement mission or GPM core observatory satellite flew over Hurricane Matthew several times as the category 4 storm headed toward Florida. The GPM Core Observatory carries two instruments that show the location and intensity of rain and snow, which defines a crucial part of the storm structure – and how it will behave. The GPM Microwave Imager sees through the tops of clouds to observe how much and where precipitation occurs, and the Dual-frequency Precipitation Radar observes precise details of precipitation in 3-dimensions. This data...
NASA Sees Hermine's Twin Towers
In order for Hermine or any other tropical depression, to intensify there must be a pathway for heat energy from the ocean surface to enter the atmosphere. For Hermine, the conduit may have been one of the two "hot towers" that the Global Precipitation Measurement mission or GPM core satellite observed on Aug. 31 at 4:09 p.m. EDT (2009 UTC). GPM's DPR instrument saw strong storms near the center of Tropical Depression Hermine on the evening of Aug. 31. Two "hot towers" are seen to the right of the low pressure center (south and east of the center), which are labeled "T1" and "T2." The "L"...
Storm Brings Heavy Precipitation to Northeast
UPDATE 1/23/2016 5:00pm ET On January 23, 2016 at 1239 UTC (7:39 AM EST) the GPM core observatory passed above the deadly winter storm that was burying the Northeast under a deep layer of snow. As GPM passed above a band of snow was shown approaching the island of Manhattan. The winter storm was predicted to dump near record snowfall in New York city. GPM's Microwave Imager (GMI) and Dual-frequency Precipitation Radar (DPR) instruments showed massive amounts of moisture being transported from the Atlantic Ocean over states from New York westward through West Virginia. GPM's Radar instruments...
<iframe width="490" height="276" src="https://www.youtube.com/embed/oiGzKmfOvkg?rel=0" frameborder="0" allowfullscreen></iframe>
As we enter the new year, take a look back at the snowstorms, tropical storms, typhoons, hurricanes and floods captured and analyzed by the Global Precipitation Measurement (GPM) mission from around the globe during 2015. The complete list of storms by date and location are as follows: 1. New England Nor’easter – January 26 – New England, USA 2. Snowstorm – February 17 – Kentucky, Virginia and North Carolina, USA 3. Tornadic Thunderstorms in Midwest – March 25 – Oklahoma and Arkansas, USA 4. Typhoon Maysak – March 30 – Yap Islands, Southwest Pacific Ocean 5. Rain Accumulation from Cyclone...
Hurricane Patricia Makes Landfall in Mexico
The eye of hurricane Patricia hit the Mexican coast on October 23, 2015 at approximately 6:15 PM CDT(2315 UTC)near Cuixmala, Mexico. The maximum winds at that time were estimated to be 143 kts (165 mph). Patricia is weakening rapidly but continued heavy rain is expected to cause flash floods and mudslides in the Mexican states of Nayarit, Jalisco, Colima, Michoacan and Guerrero through Saturday October 24, 2015. Over the weekend the remants of Patricia are also expected to add to the extreme rainfall in Texas. Rainfall from a stalled front that has been causing flooding in northern and central...
https://www.youtube.com/watch?v=8eIwMXnU8IA&feature=youtu.be
A narrated visualization of Typhoon Kilo. Click here for a full transcript. Click here to download this video in high resolution from the NASA Goddard Scientific Visualization Studio. The Global Precipitation Measurement (GPM) mission core satellite provided many views of Tropical Cyclone Kilo over its very long life. GPM is a satellite co-managed by NASA and the Japan Aerospace Exploration Agency that has the ability to analyze rainfall and cloud heights. GPM was able to provide data on Kilo over its 21 day life-span. The GPM core observatory satellite flew over Kilo on August 25, 2015 at...
GPM Sees Tropical Storm Bill Over Texas
Download in hi-res from the NASA Goddard Scientific Visualization Studio Tropical Storm Bill made landfall over Texas at approximately 11:45am CST on June 16, 2015. Shortly after midnight, GPM passed over the storm as it slowly worked it's way northward across the already drenched state of Texas. This visualization shows Bill at precisely 12:11:27am CST (6:11:27 GMT) on June 17, 2015. The GPM Core Observatory carries two instruments that show the location and intensity of rain and snow, which defines a crucial part of the storm structure – and how it will behave. The GPM Microwave Imager sees...
3D Views of February Snow Storms from GPM
Download this video in HD formats from NASA Goddard's Scientific Visualization Studio The Global Precipitation Measurement (GPM) Core Observatory captured a 3-D image of a winter storm on Feb. 17, 2015, that left 6 to 12 inches of snow over much of Kentucky, southwestern West Virginia and northwestern North Carolina. The shades of blue indicate rates of snowfall, with more intense snowfall shown in darker blue. Intense rainfall is shown in red. The imagery shows great variation in precipitation types over the southeastern United States. Download this video in HD formats from NASA Goddard's...
Signs of Spring Spring Weather What is spring to you?  Spring around the world March 20 - launch of contest
At 5:05 p.m. EST Monday, Jan. 26, 2015, the Global Precipitation Measurement mission's Core Observatory flew over the Nor'easter that dumped snow on New England. This satellite image shows the rate of rainfall, with low amounts in green and high in red, and snowfall, in blue to purple. The center of the storm, shown in 3-D, was offshore with far reaching bands of snowfall. More intense snow rates are shown in darker blue, which can be seen on the northern edge of the storm. Visible in the 3-D image of the center of the storm are the snowy tops of the clouds in blue and underneath where it...
GPM Dissects Super Typhoon Hagupit
On December 5, 2014 (1032UTC) the Global Precipitation Measurement (GPM) mission's Core Observatory flew over Typhoon Hagupit as it headed towards the Philippines. A few hours later at 1500 UTC (10 a.m. EST), Super Typhoon Hagupit's maximum sustained winds were near 130 knots (149.6 mph/241 kph), down from 150 knots (172 mph/277.8 kph). Typhoon-force winds extend out 40 nautical miles (46 miles/74 km) from the center, while tropical-storm-force winds extend out to 120 miles (138 miles/222 km). Animation revealing a swath of GPM/GMI precipitation rates over Typhoon Hagupit. As the camera moves...
GPM Flies Over Hurricane Gonzalo
Download in Hi-Res from the Scientific Visualization Studio On October 16th, 2014 (1342 UTC) the Global Precipitation Measurement (GPM) mission's Core Observatory flew over Hurricane Gonzalo as it headed towards Bermuda. Hurricane Gonzalo remains a category 4 hurricane on the Saffir-Simpson Hurricane Scale, with maximum sustained winds at 130 mph. As of 12:00 UTC (8:00a.m. EDT) on Friday, October 17th, the National Hurricane Center forecast located the storm about 195 miles south southwest of Bermuda, where a hurricane warning is in effect. The GPM Core Observatory carries two instruments that...
GPM Scans Typhoon Phanfone
Animation revealing a swath of GPM/GMI precipitation rates over Typhoon Phanfone. The camera then moves down closer to the storm to reveal DPR's volumetric view of Phanphone. A slicing plane dissects the Typhoon from south to north and back again, revealing it's inner precipitation rates. Shades of blue indicate frozen precipitation (in the upper atmosphere). Shades of green to red are liquid precipitation which extend down to the ground. Download in Hi-Res from the Scientific Visualization Studio On October 6, 2014 (0215 UTC) the Global Precipitation Measurement (GPM) mission's Core...
GPM Uncovers Compact Eyewall in Hurricane Simon
Hurricane Simon appeared to be keeping a secret before it rapidly intensified on Oct. 4, but the Global Precipitation Measurement or GPM satellite was able uncover it. On Oct. 4 at 0940 UTC (5:40 a.m. EDT) observations by the Ku-band radar on the GPM satellite suggested that the Eastern Pacific Ocean's Hurricane Simon was hiding a very compact eyewall hours before the National Hurricane Center detected rapid intensification of Simon's surface winds. The GPM satellite was launched in February of this year and is managed by both NASA and the Japan Aerospace Exploration Agency. On Oct. 4 at 0940...
PMM Article Image
On September 26, the Global Precipitation Measurement (GPM) satellite flew over an extra-tropical cyclone whose center was approaching Norway. The Norwegian weather service reported that this storm brought gale-force winds to parts of Norway's coast and mountains (20 m/s in the mountains and 50 m/s just off-coast, late at night on September 26). Extra-tropical cyclones this strong or stronger are a regular feature of northern European winters. The particularly damaging ones are called "windstorms." Borrowing a page from hurricane forecasters, some weather agencies in affected countries name...
GPM Captures Hurricane Odile
​ ​ Animation revealing a swath of GPM/GMI precipitation rates over Hurricane Odile. The camera then moves down closer to the Hurricane to reveal DPR's volumetric view of Odile. As the camera rotates around the Hurricane, a slicing plane dissects Odile revealing it's inner precipitation rates closer to the eye. Shades of blue indicate frozen precipitation (in the upper atmosphere). Shades of green to red are liquid precipitation which extend down to the ground. On September 15, 2014 (15:11 UTC) the Global Precipitation Measurement (GPM) mission's Core Observatory flew over Hurricane Odile as...
GPM Satellite Sees First Atlantic Hurricane
Animation of NASA-JAXA's GPM satellite data of rain rates and internal structure of Hurricane Arthur on July 3 2014. Image Credit: NASA's Scientific Visualization Studio / JAXA Download the Hi-Res Video Here The Global Precipitation Measurement (GPM) Core Observatory flew over Hurricane Arthur five times between July 1 and July 5, 2014. Arthur is the first tropical cyclone of the 2014 Atlantic hurricane season. GPM is a joint mission between NASA and the Japan Aerospace Exploration Agency. The Core Observatory was launched Feb. 27 from Japan and began its prime mission on May 29, just in time...

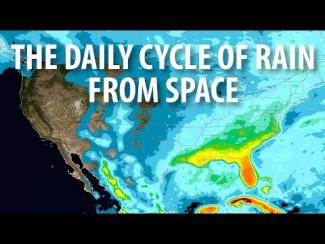
The most detailed view of our daily weather has been created using NASA's newest extended precipitation record known as the Integrated Multi-satellitE Retrievals for GPM, or IMERG analysis. The IMERG analysis combines almost 20 years of rain and snow data from the Tropical Rainfall Measuring Mission (TRMM) and the joint NASA-JAXA Global Precipitation Measurement mission (GPM). The daily cycle of weather, also known as the diurnal cycle, shapes how and when our weather develops and is fundamental to regulating our climate.

Music Credits: "Battle For Our Future" and "Wonderful Orbit" by Tom...

NASA engineer Manuel Vega can see one of the Olympic ski jump towers from the rooftop of the South Korean weather office where he is stationed. Vega is not watching skiers take flight, preparing for the 2018 PyeongChang Winter Olympics and Paralympic games. Instead, he’s inspecting the SUV-sized radar beside him. The instrument is one 11 NASA instruments specially transported to the Olympics to measure the quantity and type of snow falling on the slopes, tracks and halfpipes. NASA will make these observations as one of 20 agencies from eleven countries in the Republic of Korea as participants...

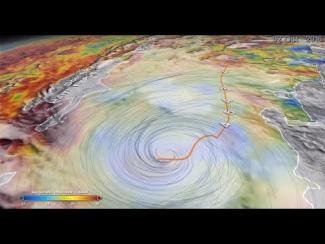
NASA researchers now can use a combination of satellite observations to re-create multi-dimensional pictures of hurricanes and other major storms in order to study complex atmospheric interactions. In this video, they applied those techniques to Hurricane Matthew. When it occurred in the fall of 2016, Matthew was the first Category 5 Atlantic hurricane in almost ten years. Its torrential rains and winds caused significant damage and loss of life as it coursed through the Caribbean and up along the southern U.S. coast. 

Music: "Buoys," Donn Wilkerson, Killer Tracks; "Late Night Drive," Donn...

NASA scientists can measure the size and shape distribution of snow particles, layer by layer, in a storm. The Global Precipitation Measurement mission is an international satellite project that provides next-generation observations of rain and snow worldwide every three hours.

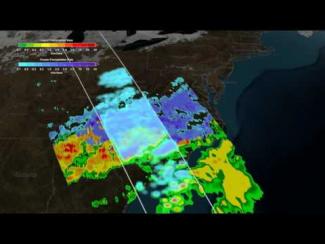
The Global Precipitation Measurement (GPM) Core Satellite captured a 3-D image of a winter storm on February 17, 2015, that left six to 12 inches of snow over much of Kentucky, southwestern West Virginia, and northwestern North Carolina. The shades of blue in the 3-D image indicate rates of snowfall with more intense snowfall shown in darker blue. Underneath where it melts into rain, the most intense rainfall is shown in red. You can see a lot of variation in precipitation types over the southeastern portion of the United States.

The GPM Core Observatory carries two instruments that show the...

Hide Body

Hide Date