

Precipitation Climatology
Overview
The two-decade satellite precipitation record collected by GPM, TRMM and the GPM constellation satellites provides a valuable method to observe long-term trends and patterns in Earth's precipitation over time. By analyzing the data in this record we can determine the average precipitation that falls around the globe and produce precipitation climatology maps. We can then compare these long-term averages with short-term precipitation events to see how much they deviate, and produce maps of precipitation anomalies. Among other things, this allows us to quantify the severity of extreme precipitation events and droughts. Departures from the climatology are a key way of understanding our changing weather patterns.
Together, these climatology and anomaly datasets give us a clearer picture of how precipitation is distributed around the world and how it is changing over time.
Grand Average Precipitation Climatology
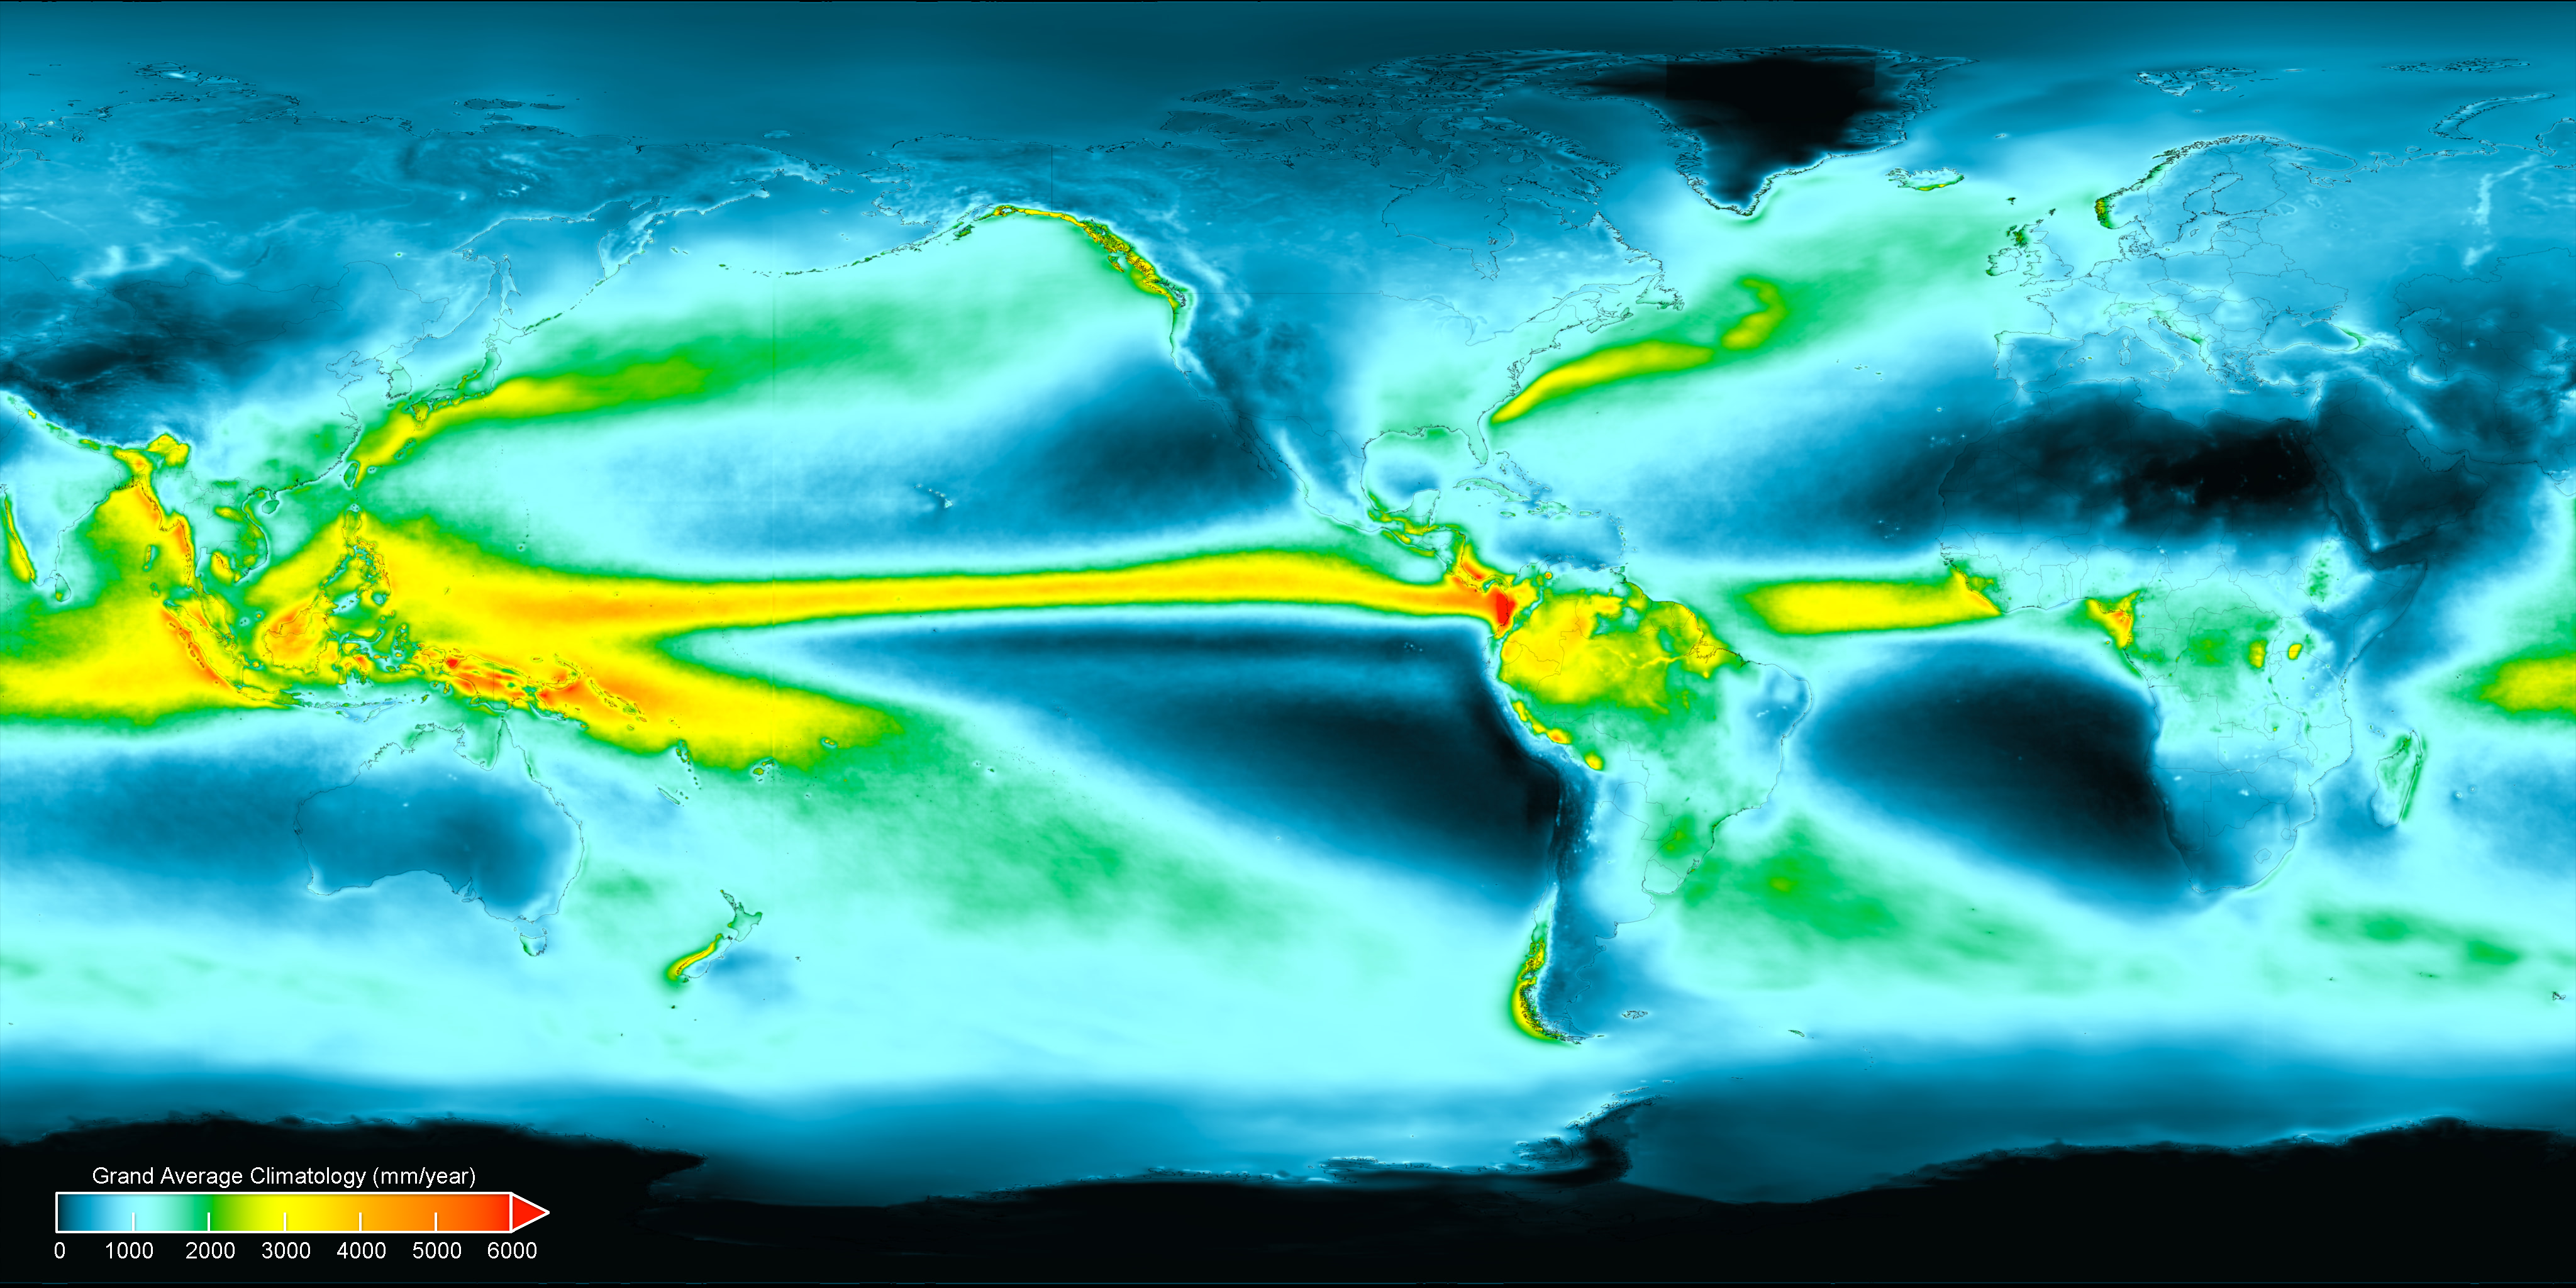
This IMERG Grand Average Climatology image shows the average amount of precipitation that falls in the world each year (mm/year), computed from June 2000 - May 2023.
- View and download this image in different formats from the NASA Goddard Scientific Visualization Studio.
- Download a .zip file with a GeoTIFF version of the IMERG Grand Average Climatology data (~26 MB)
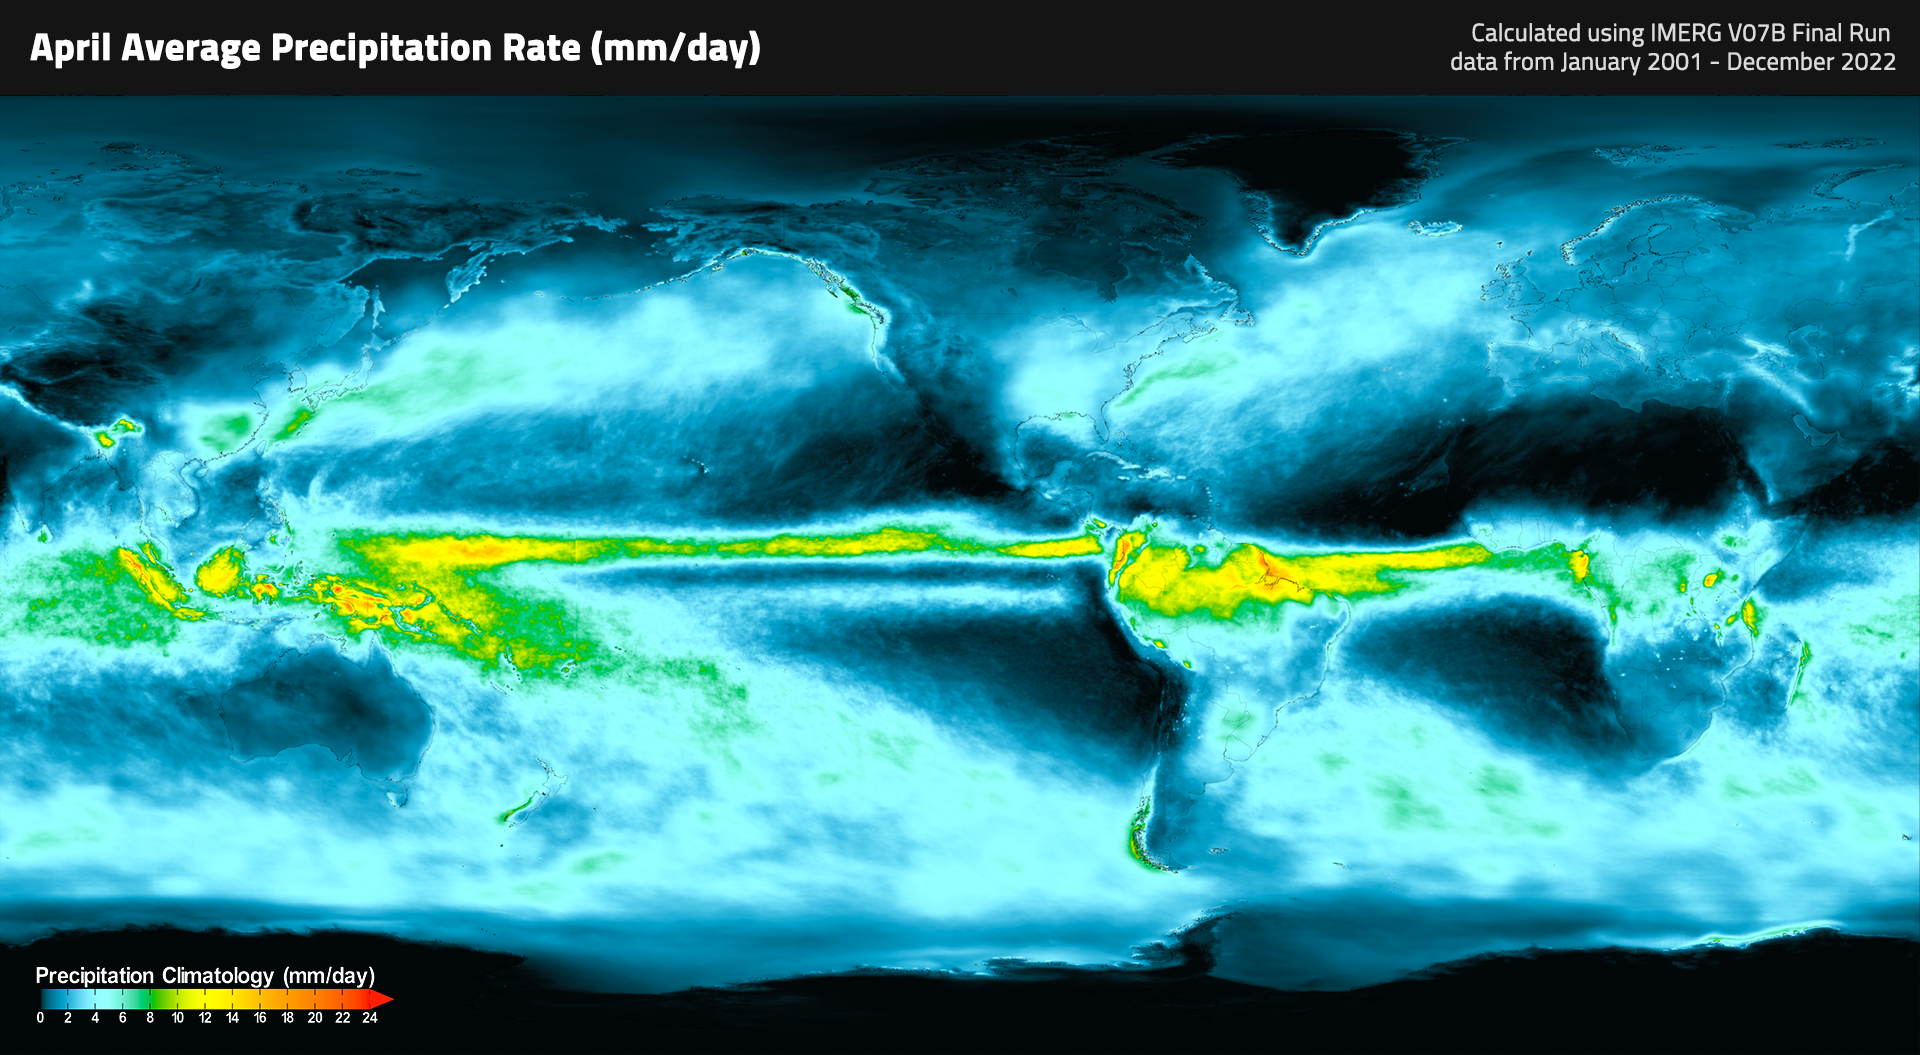
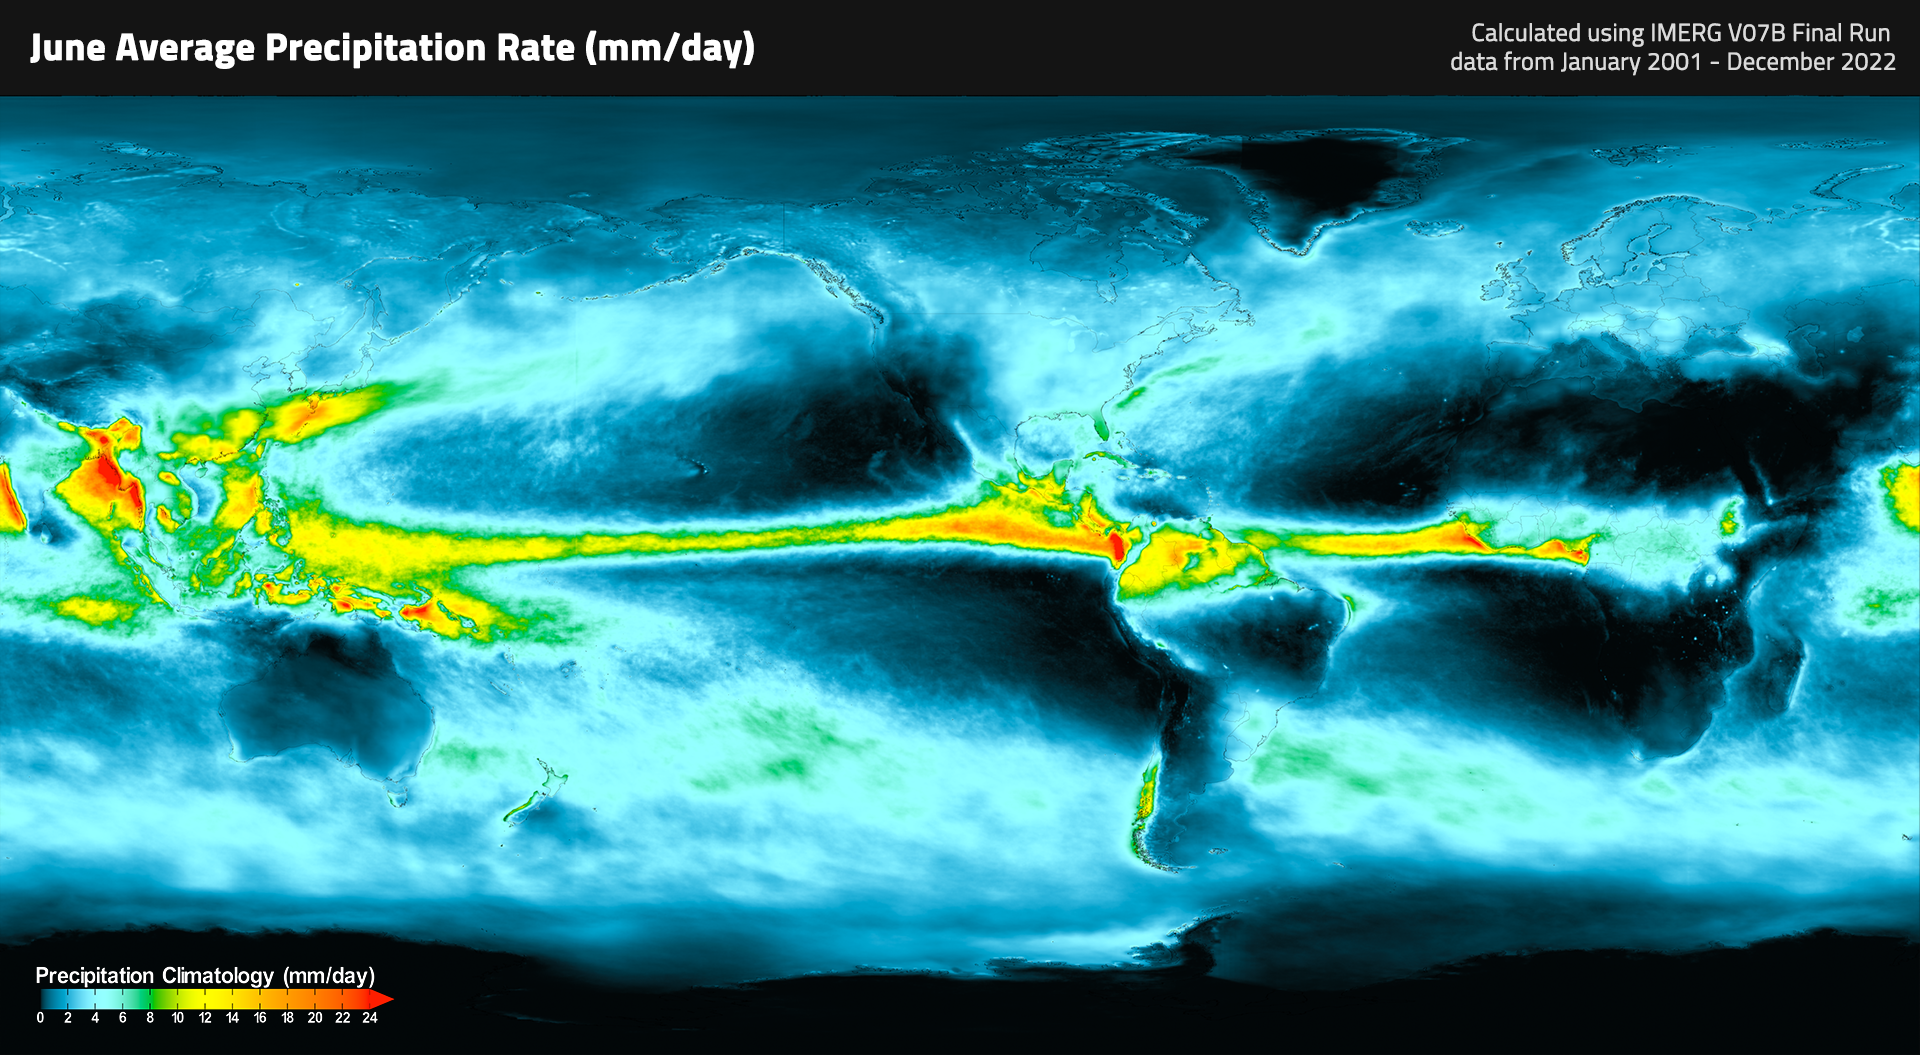
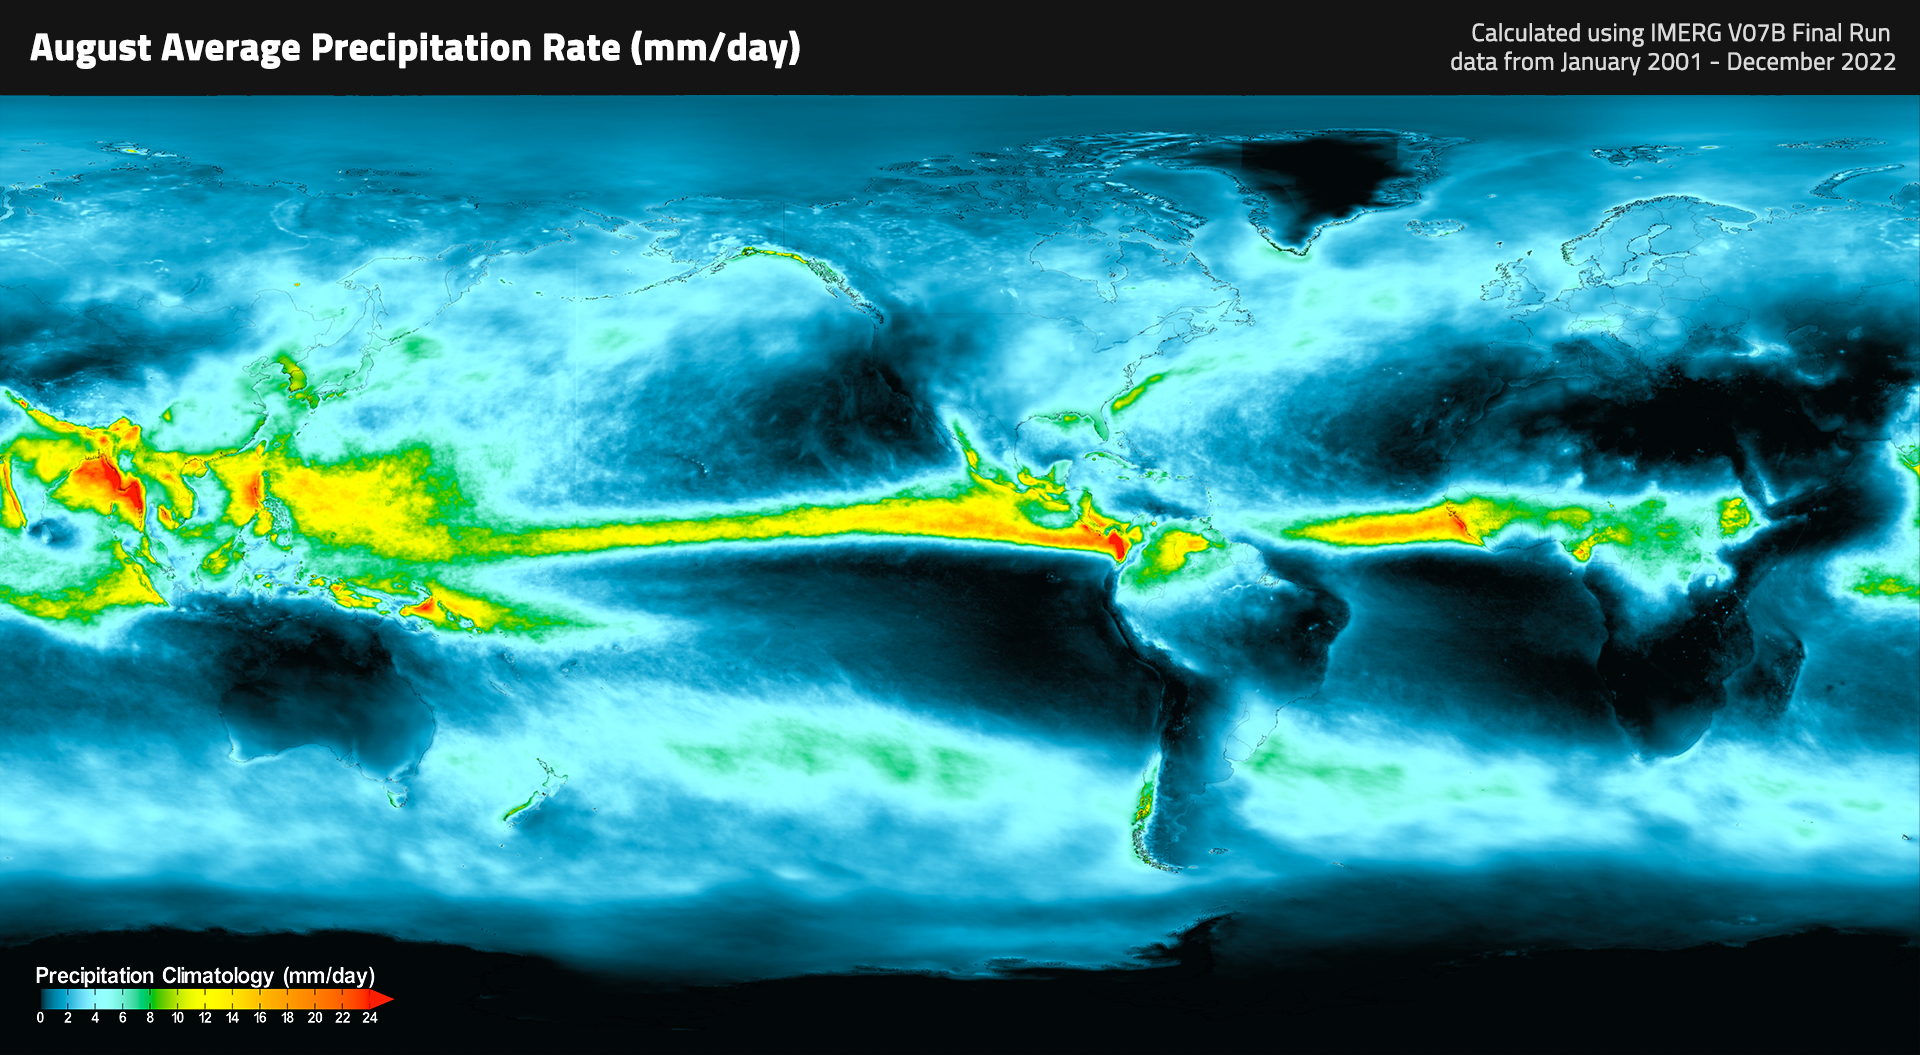
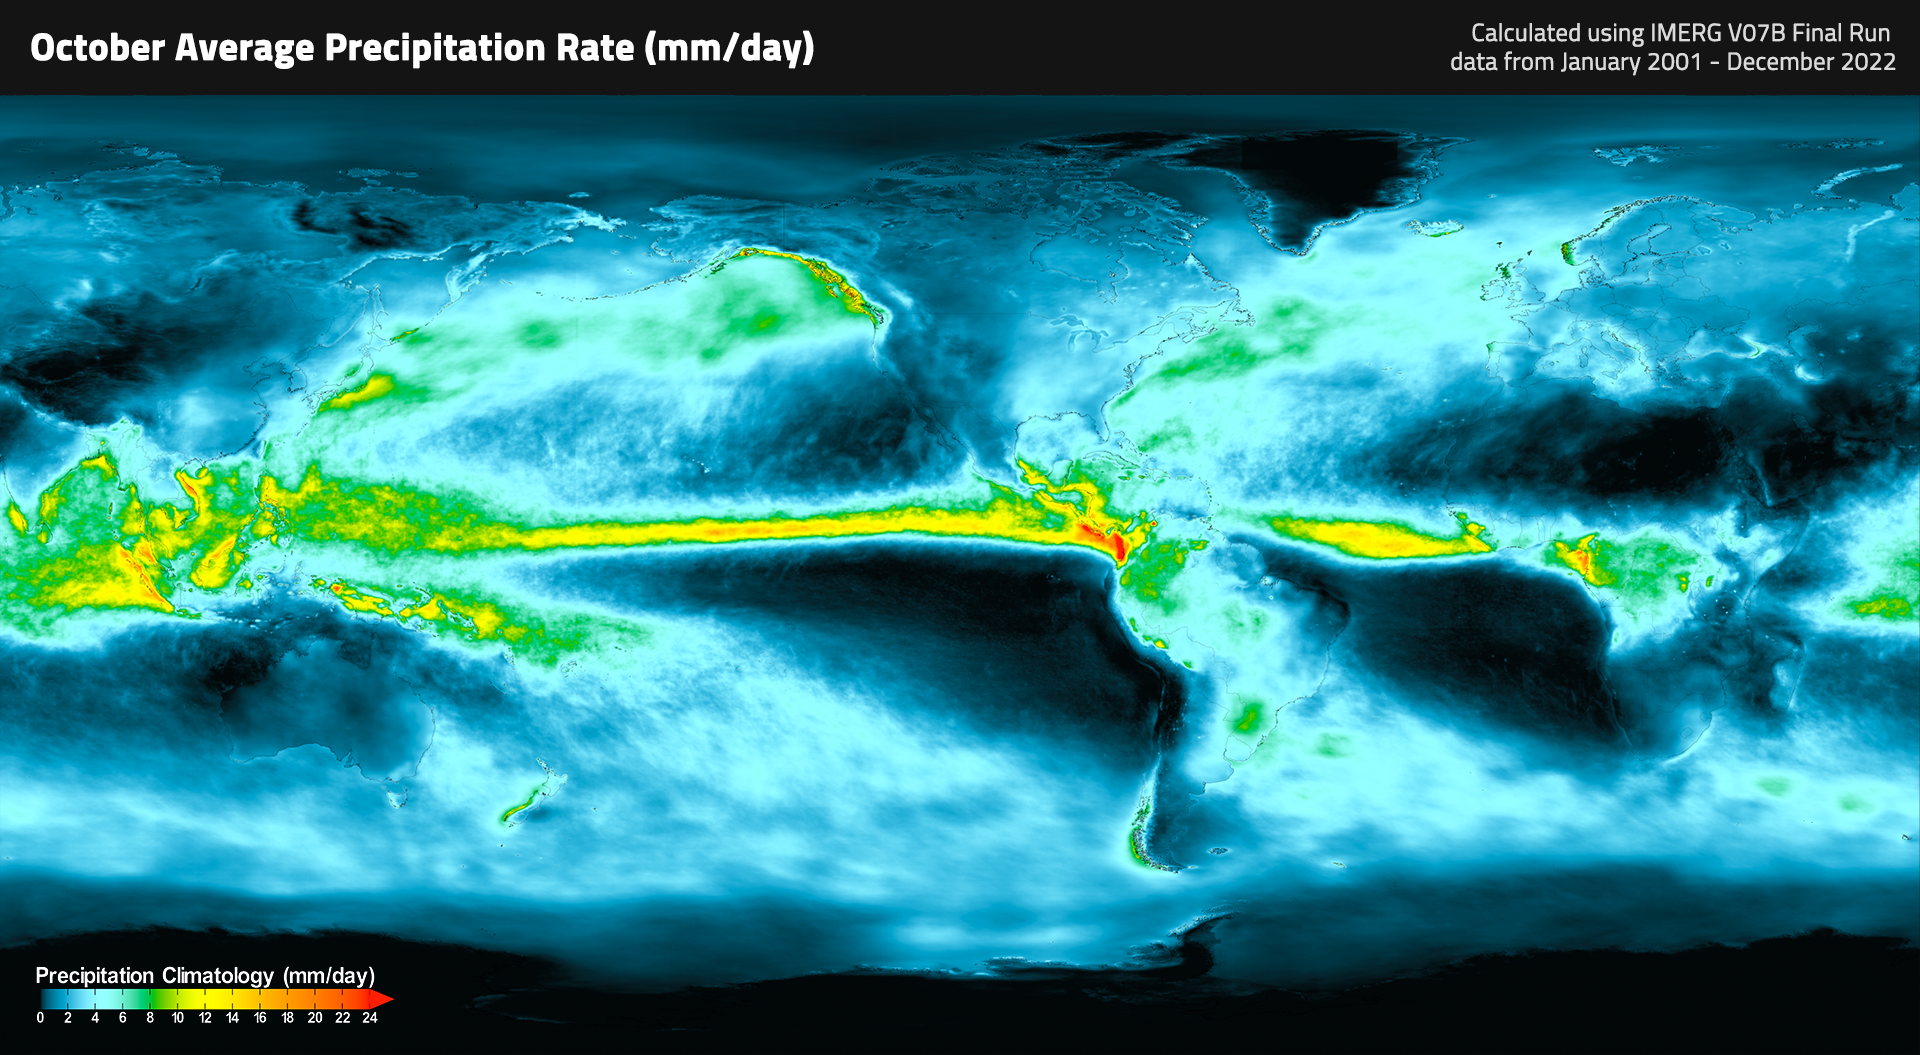
Monthly Precipitation Climatology
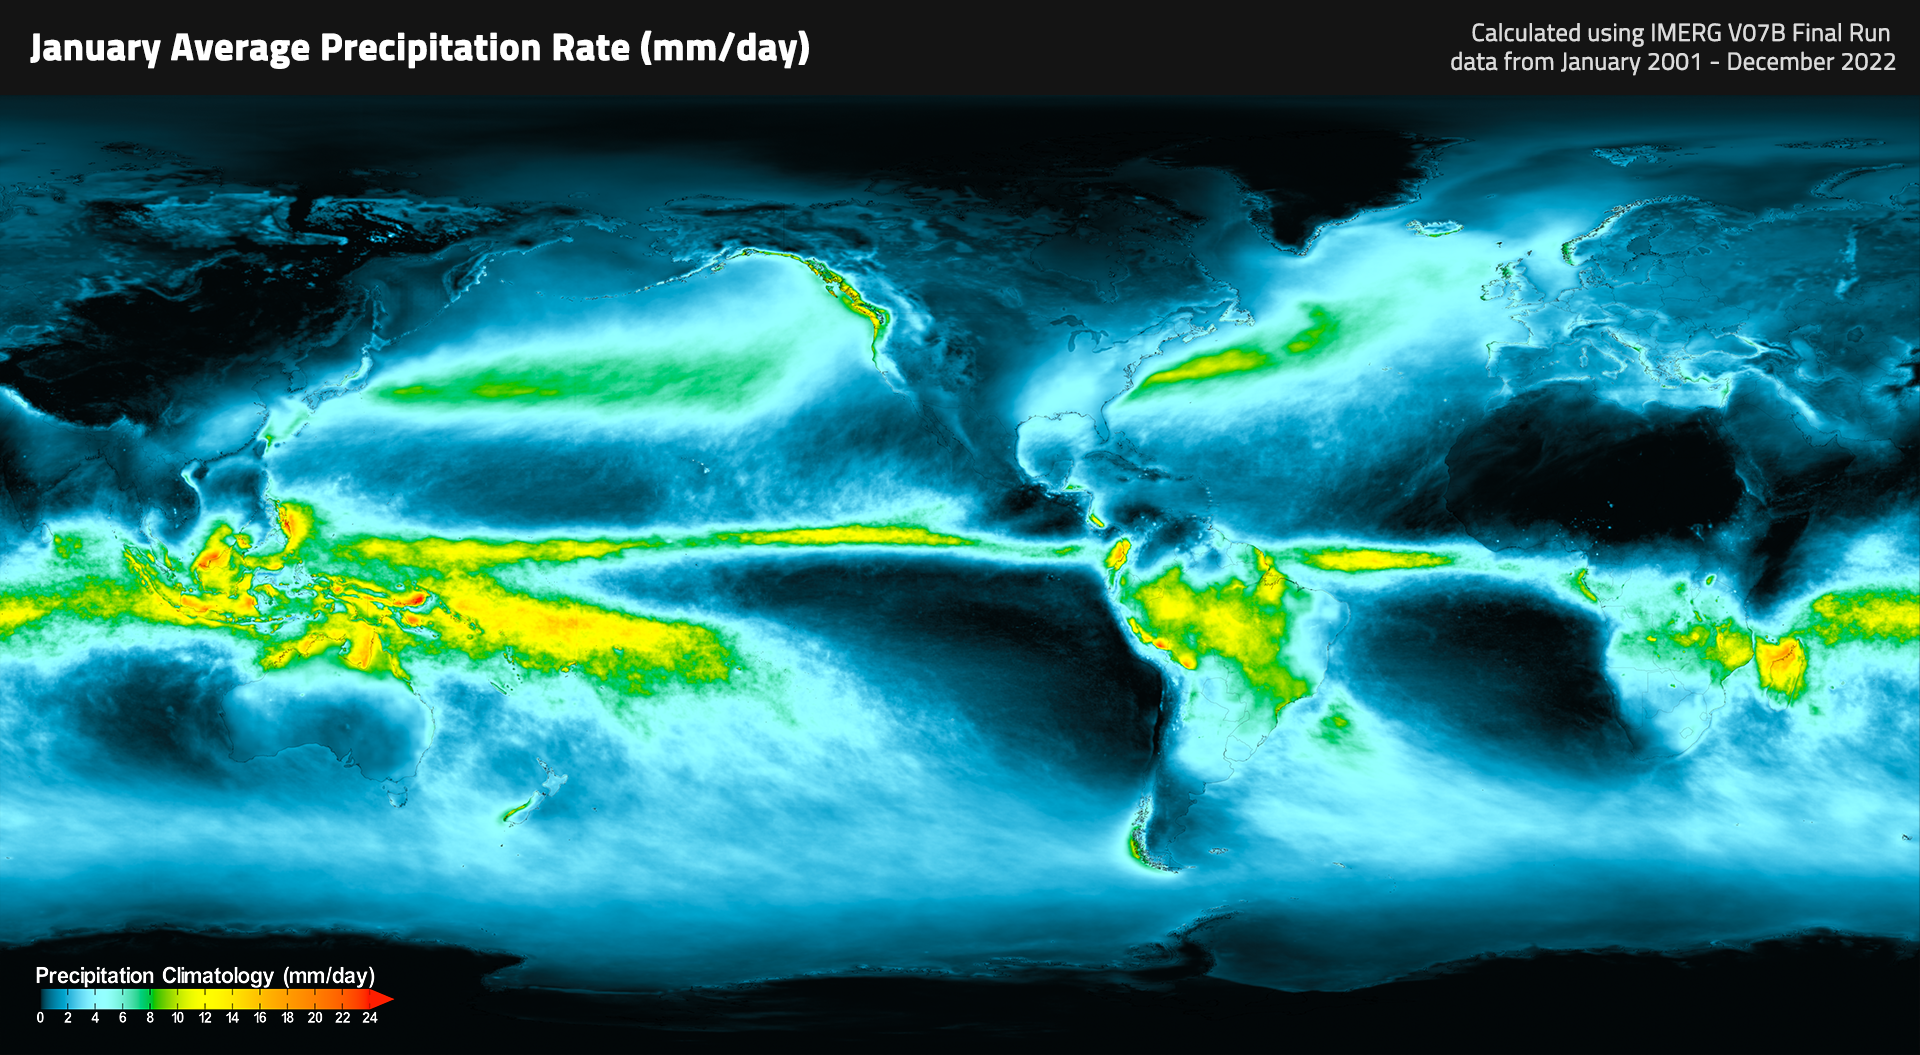
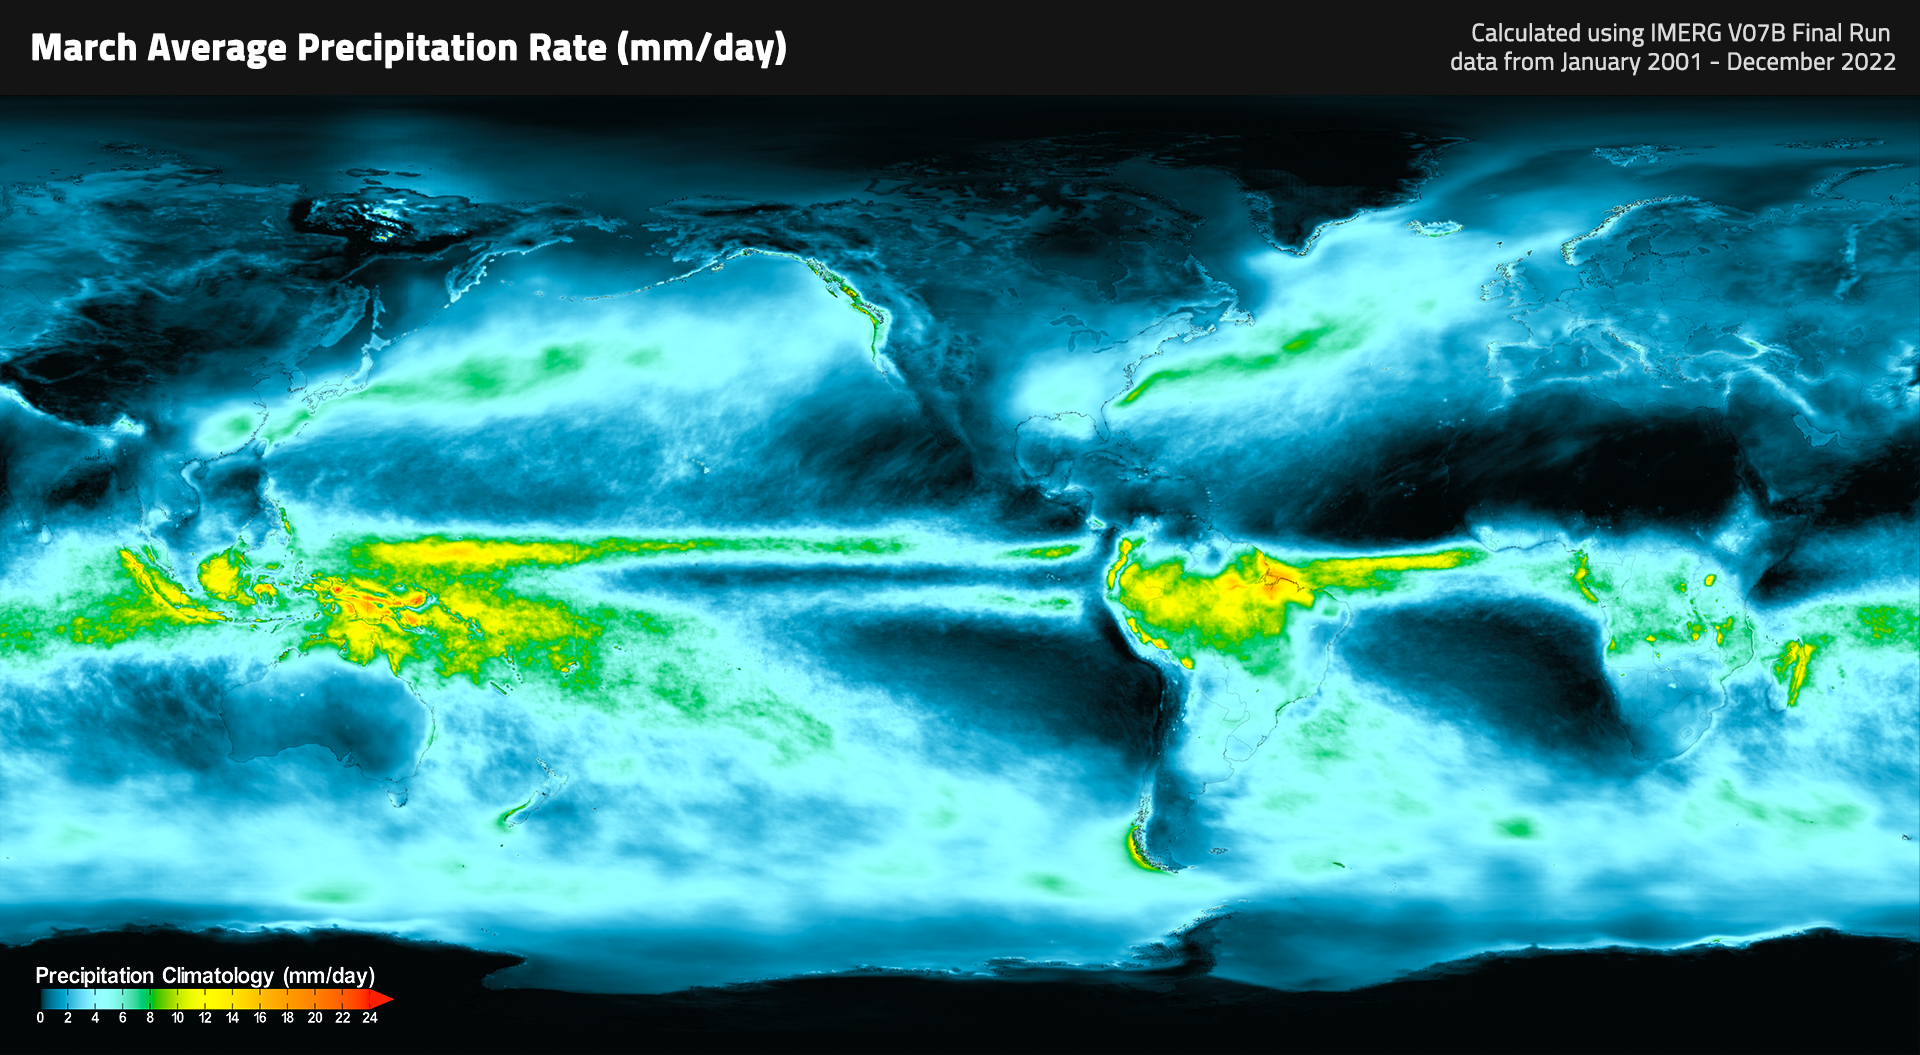
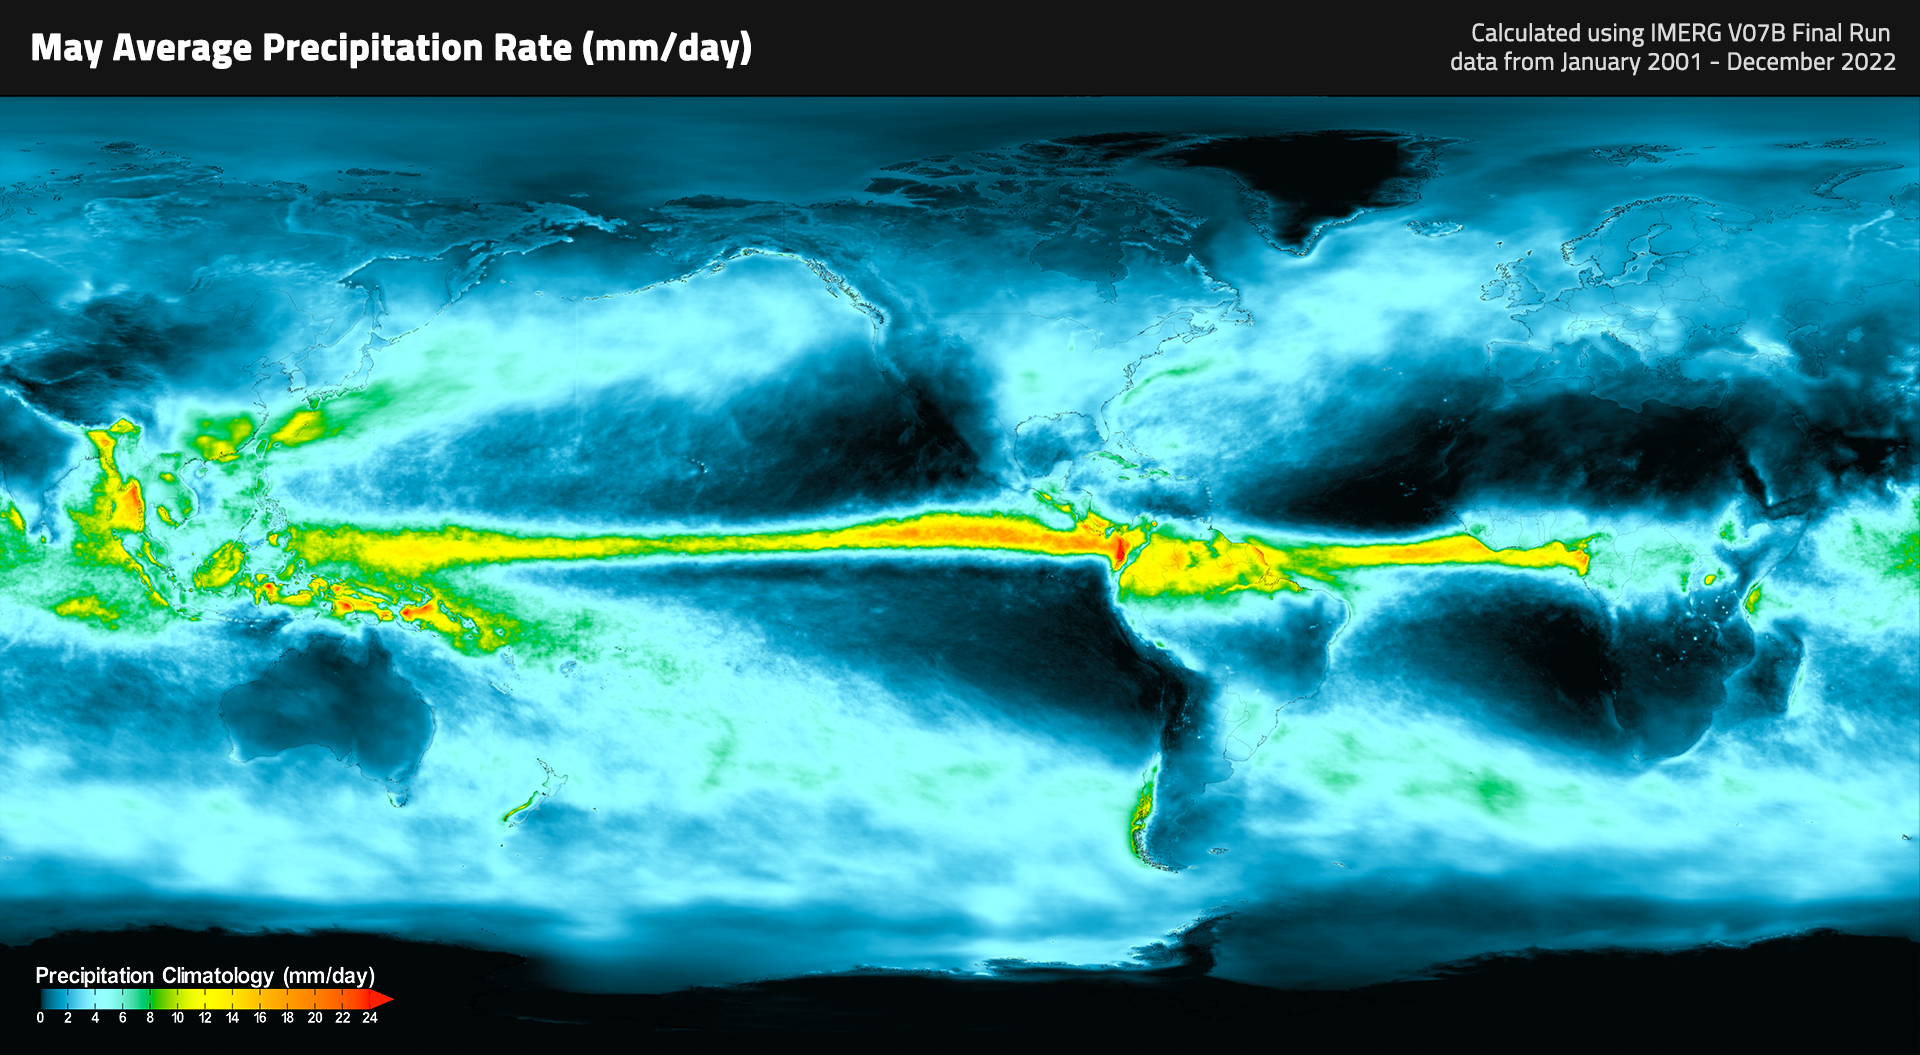
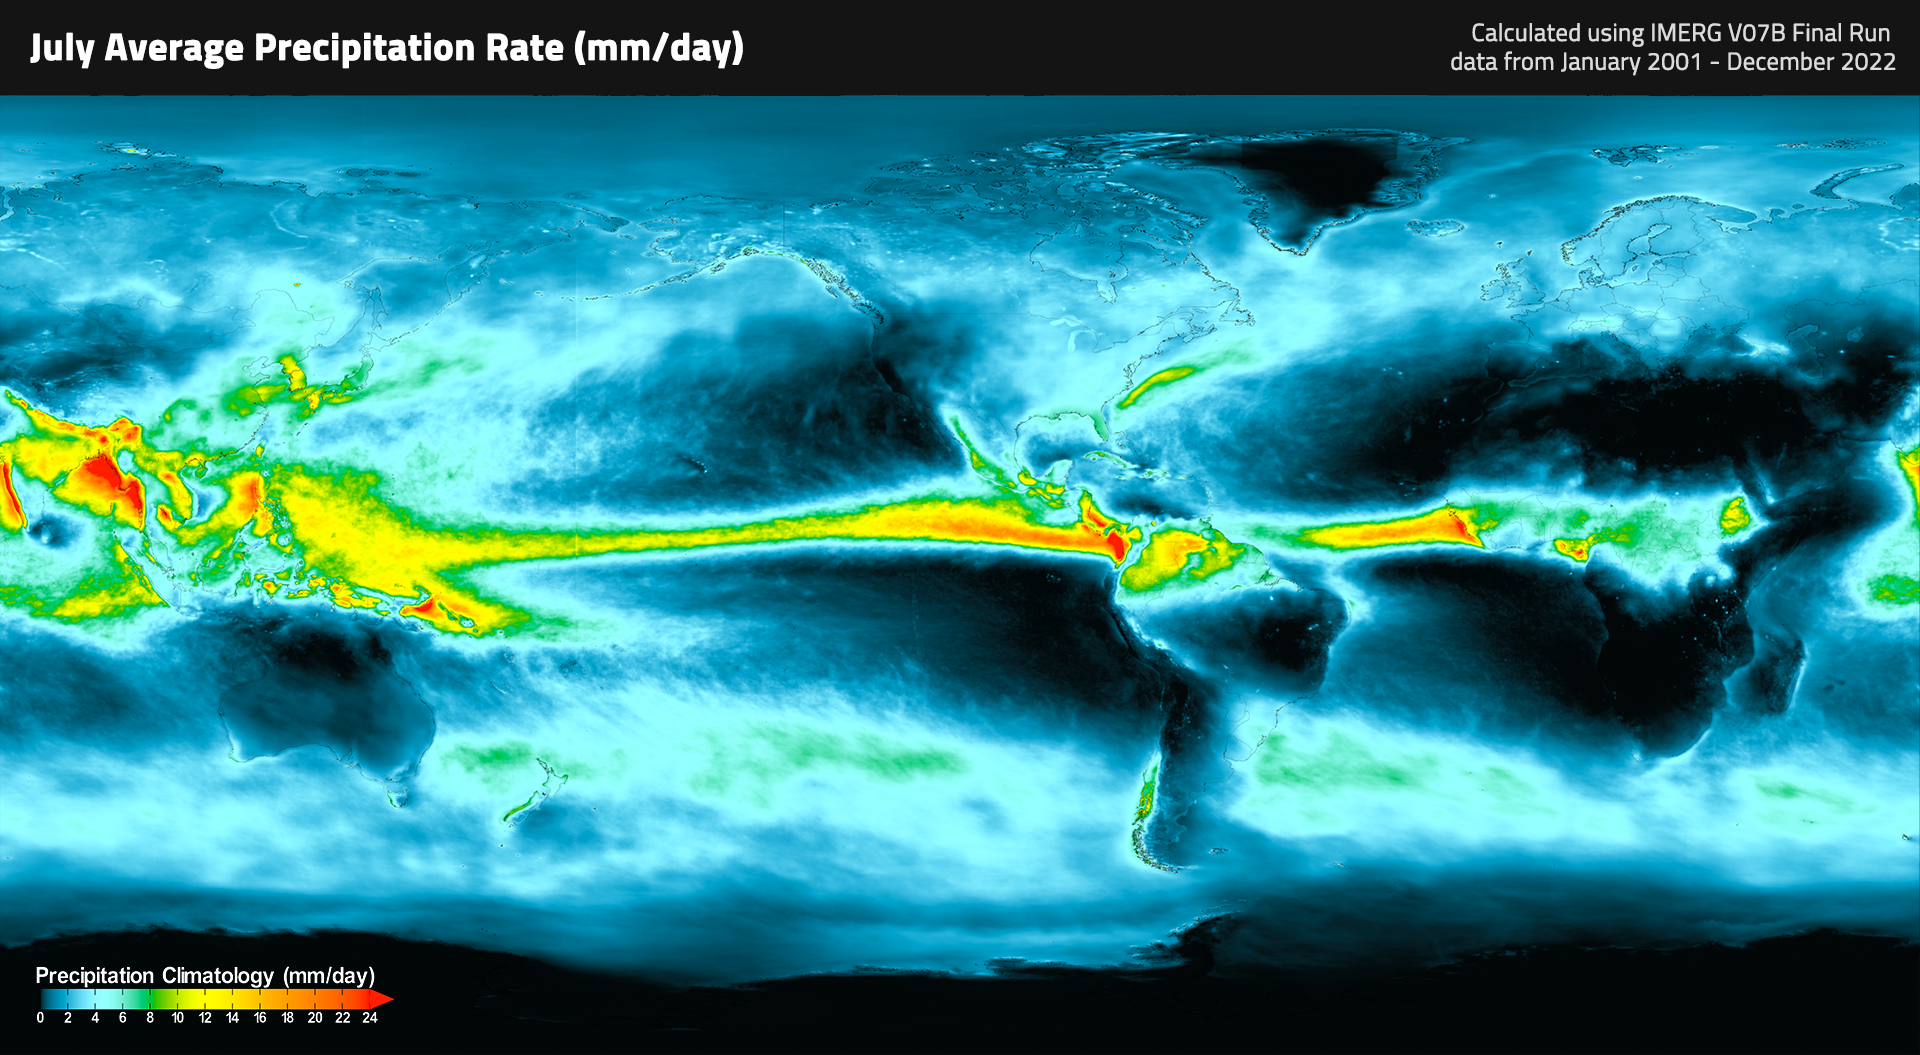
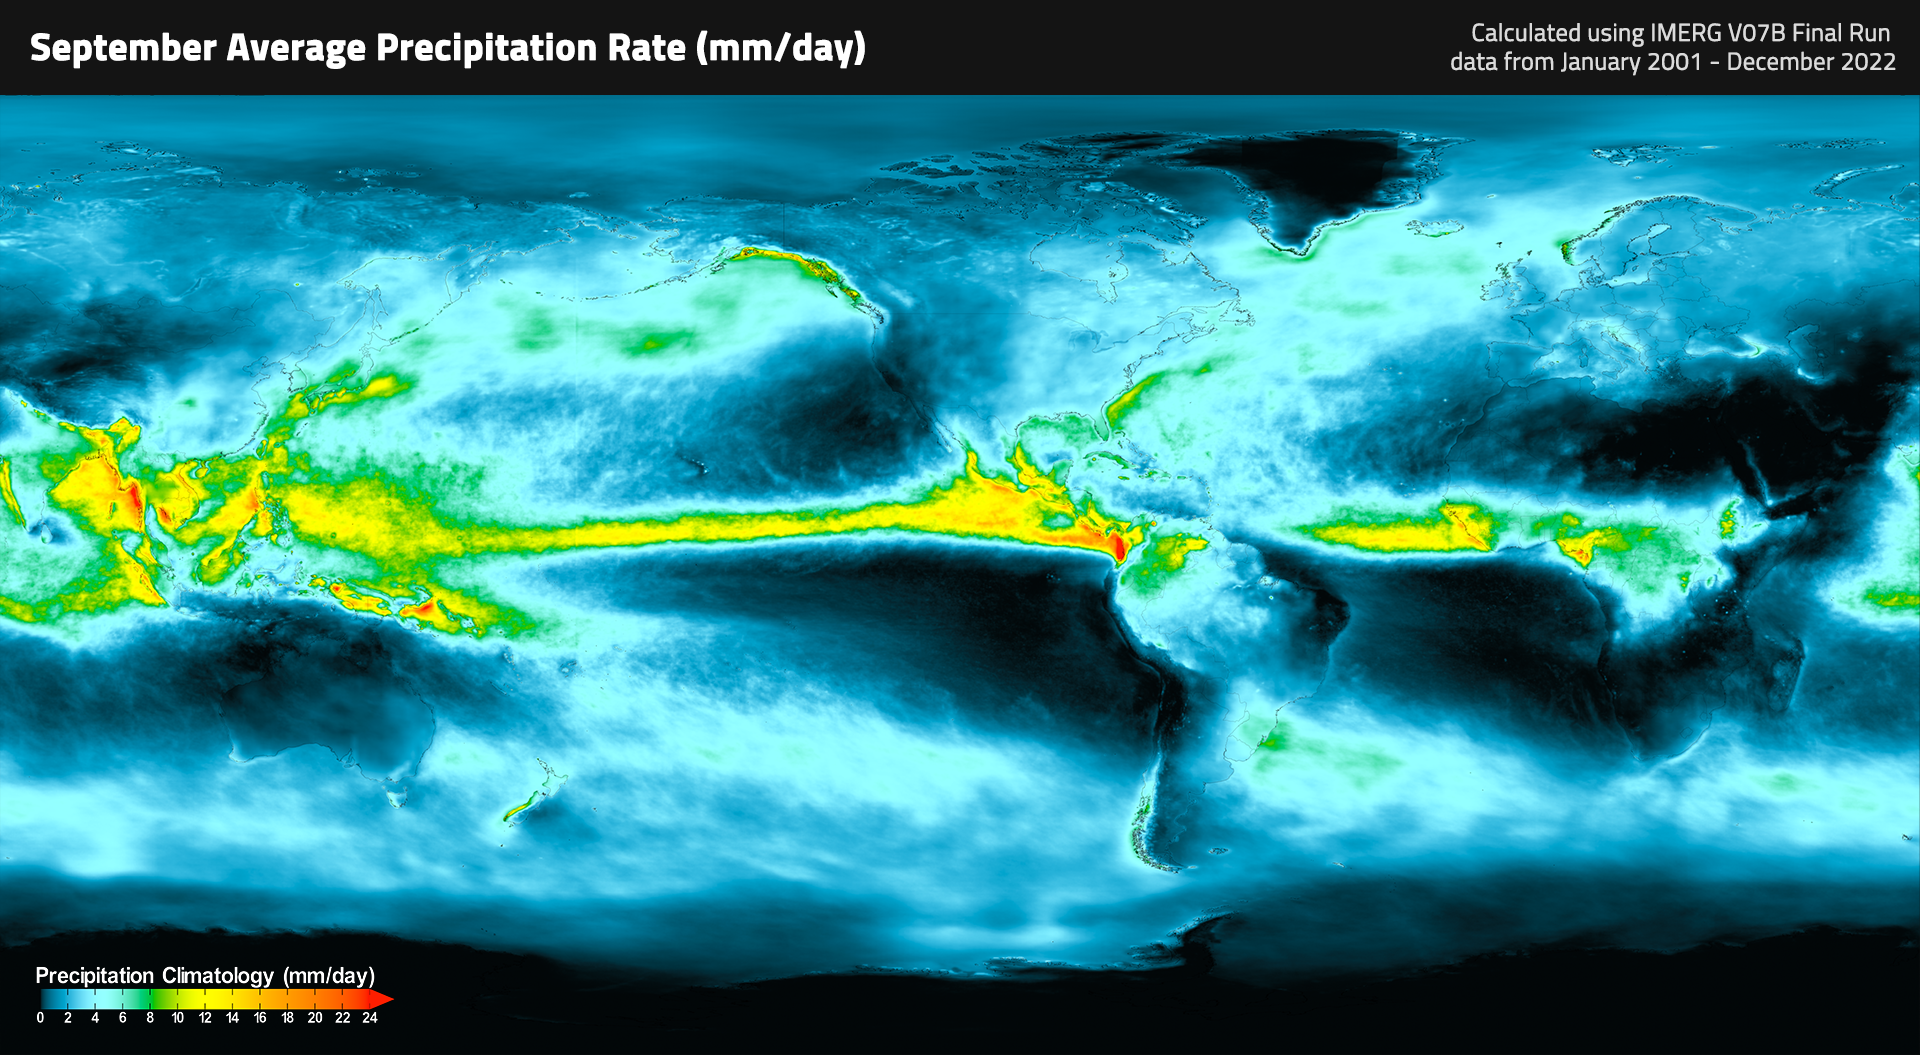
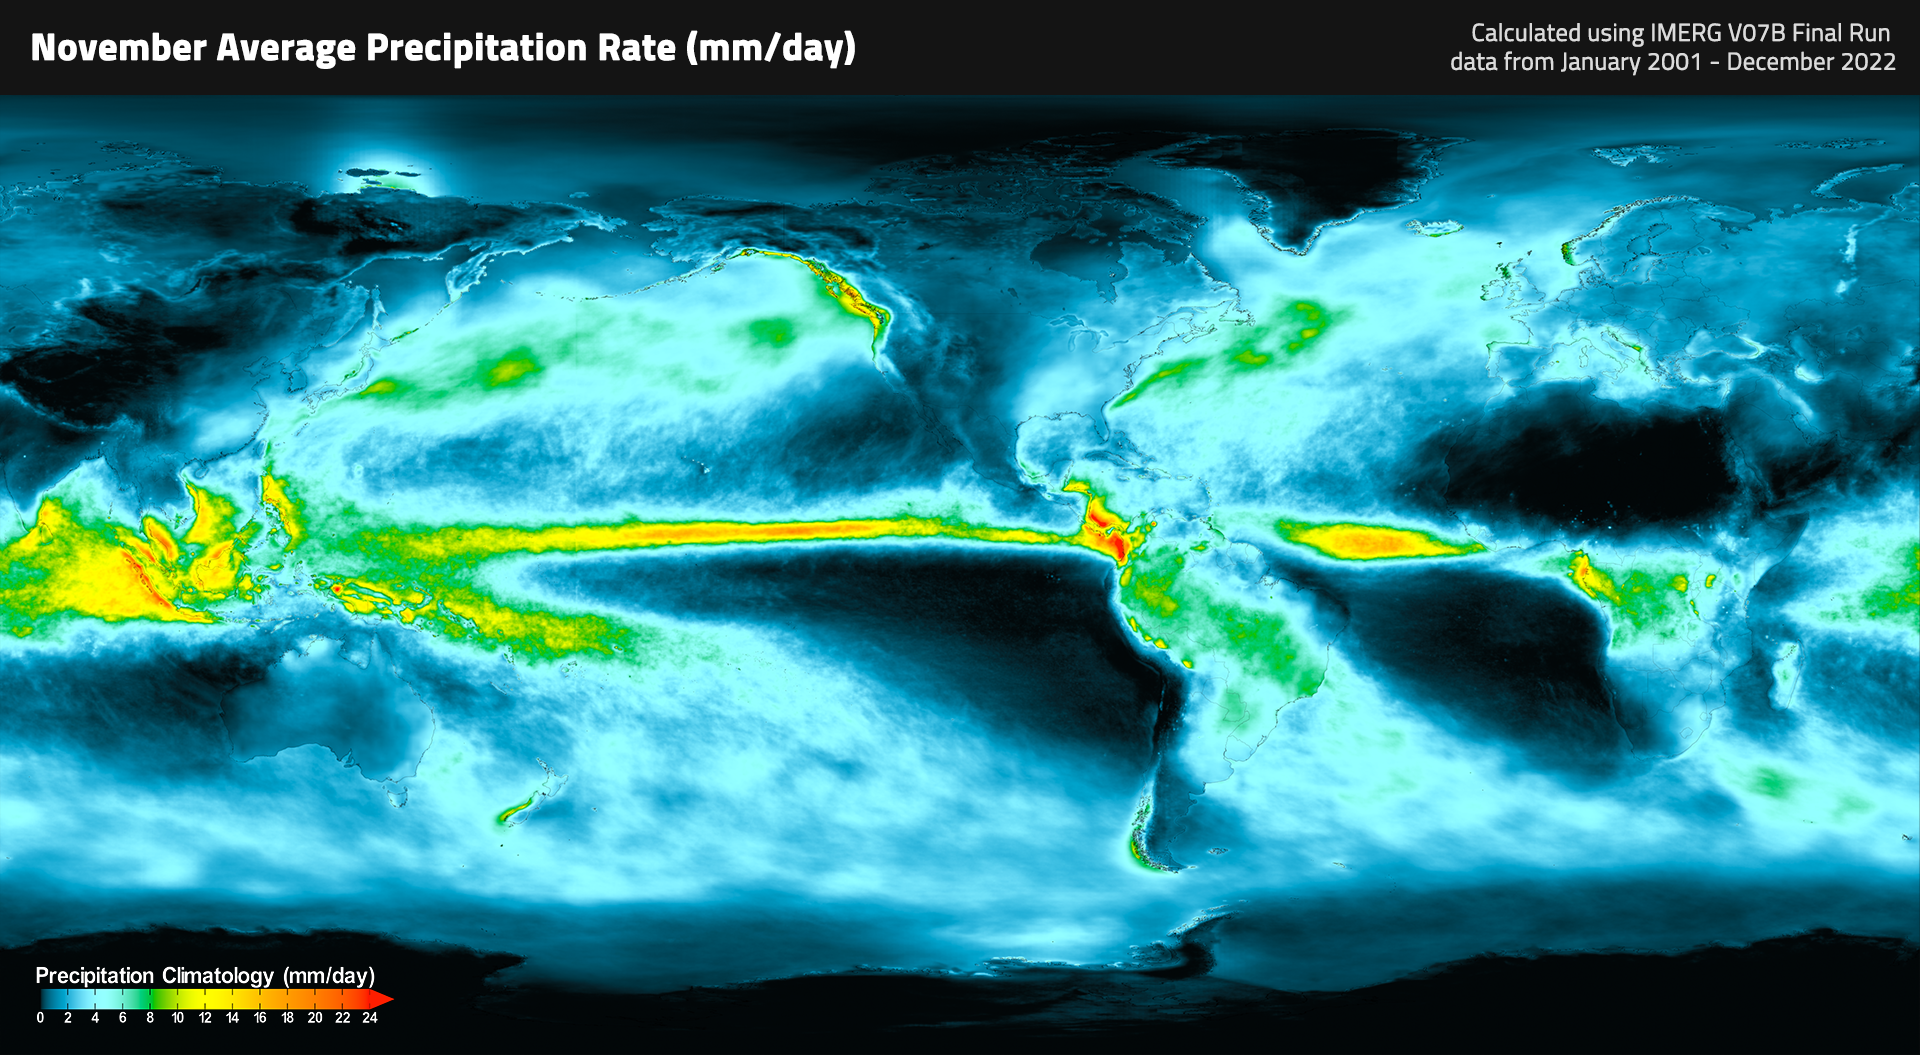
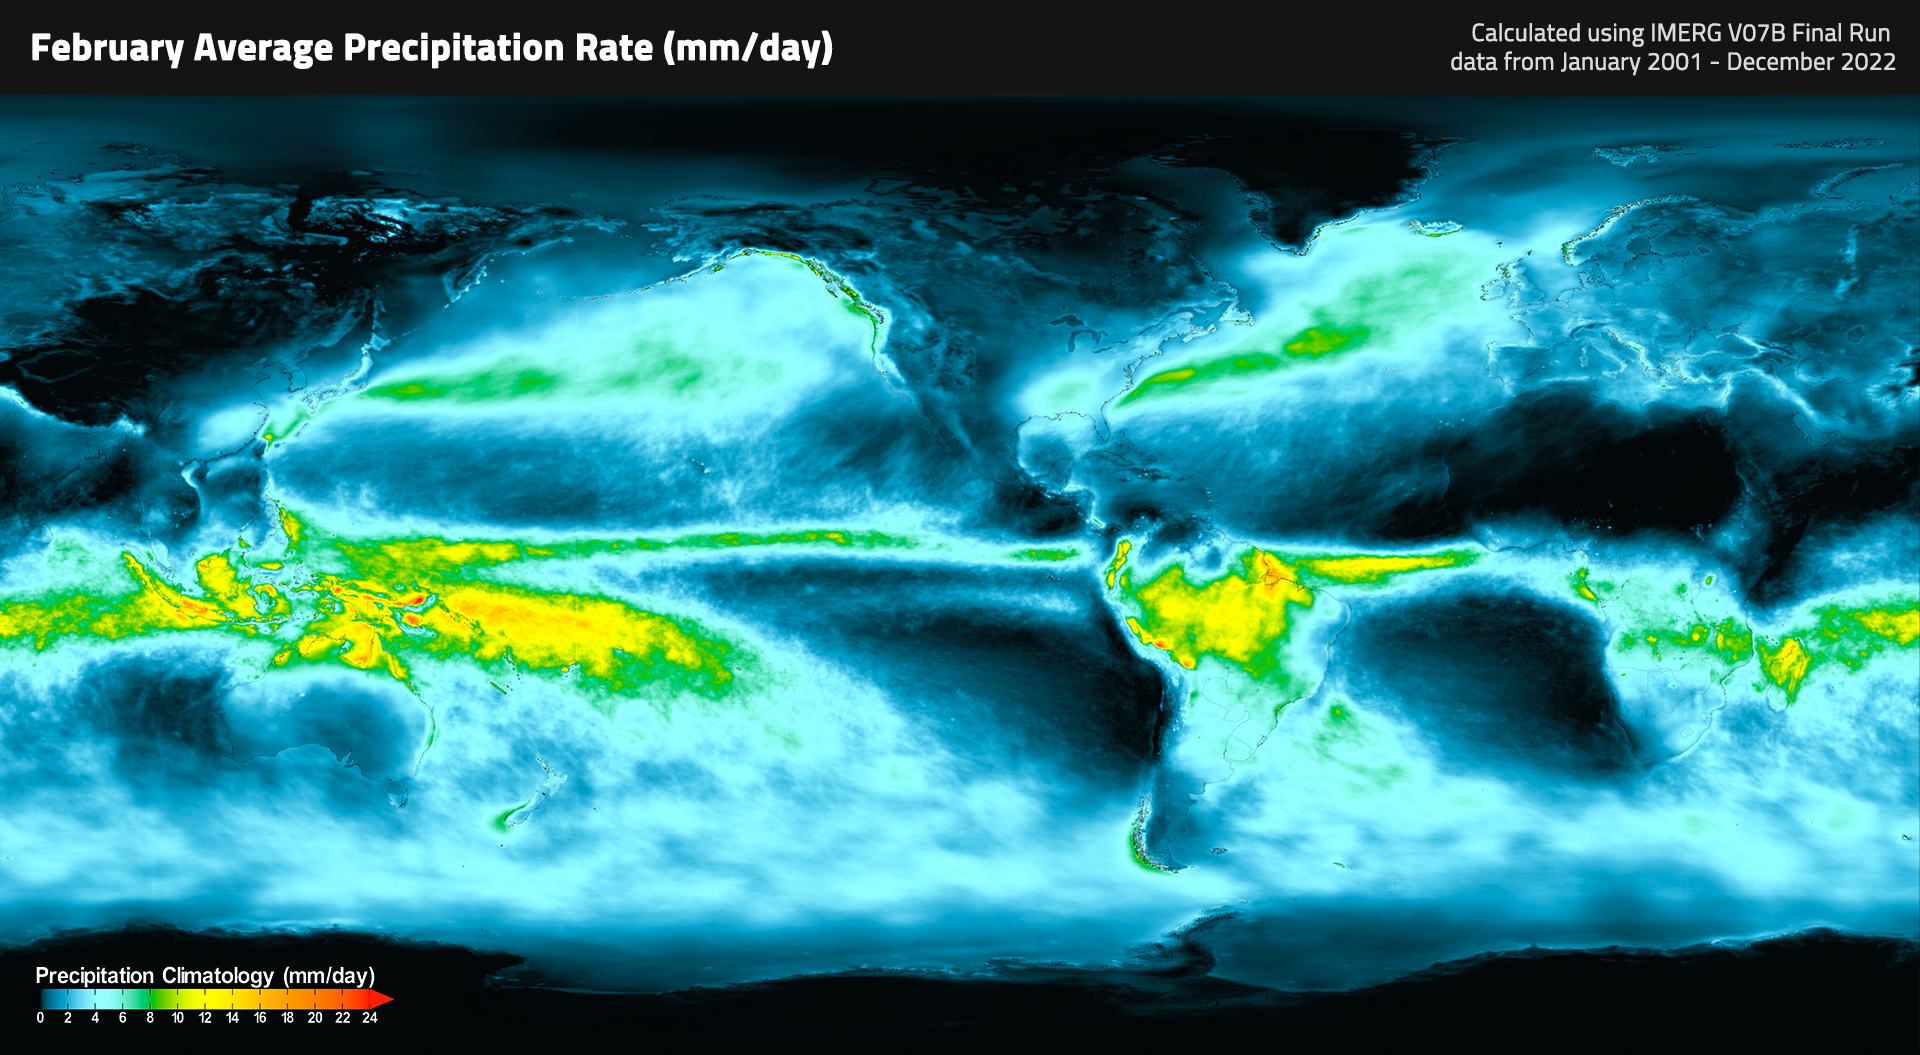
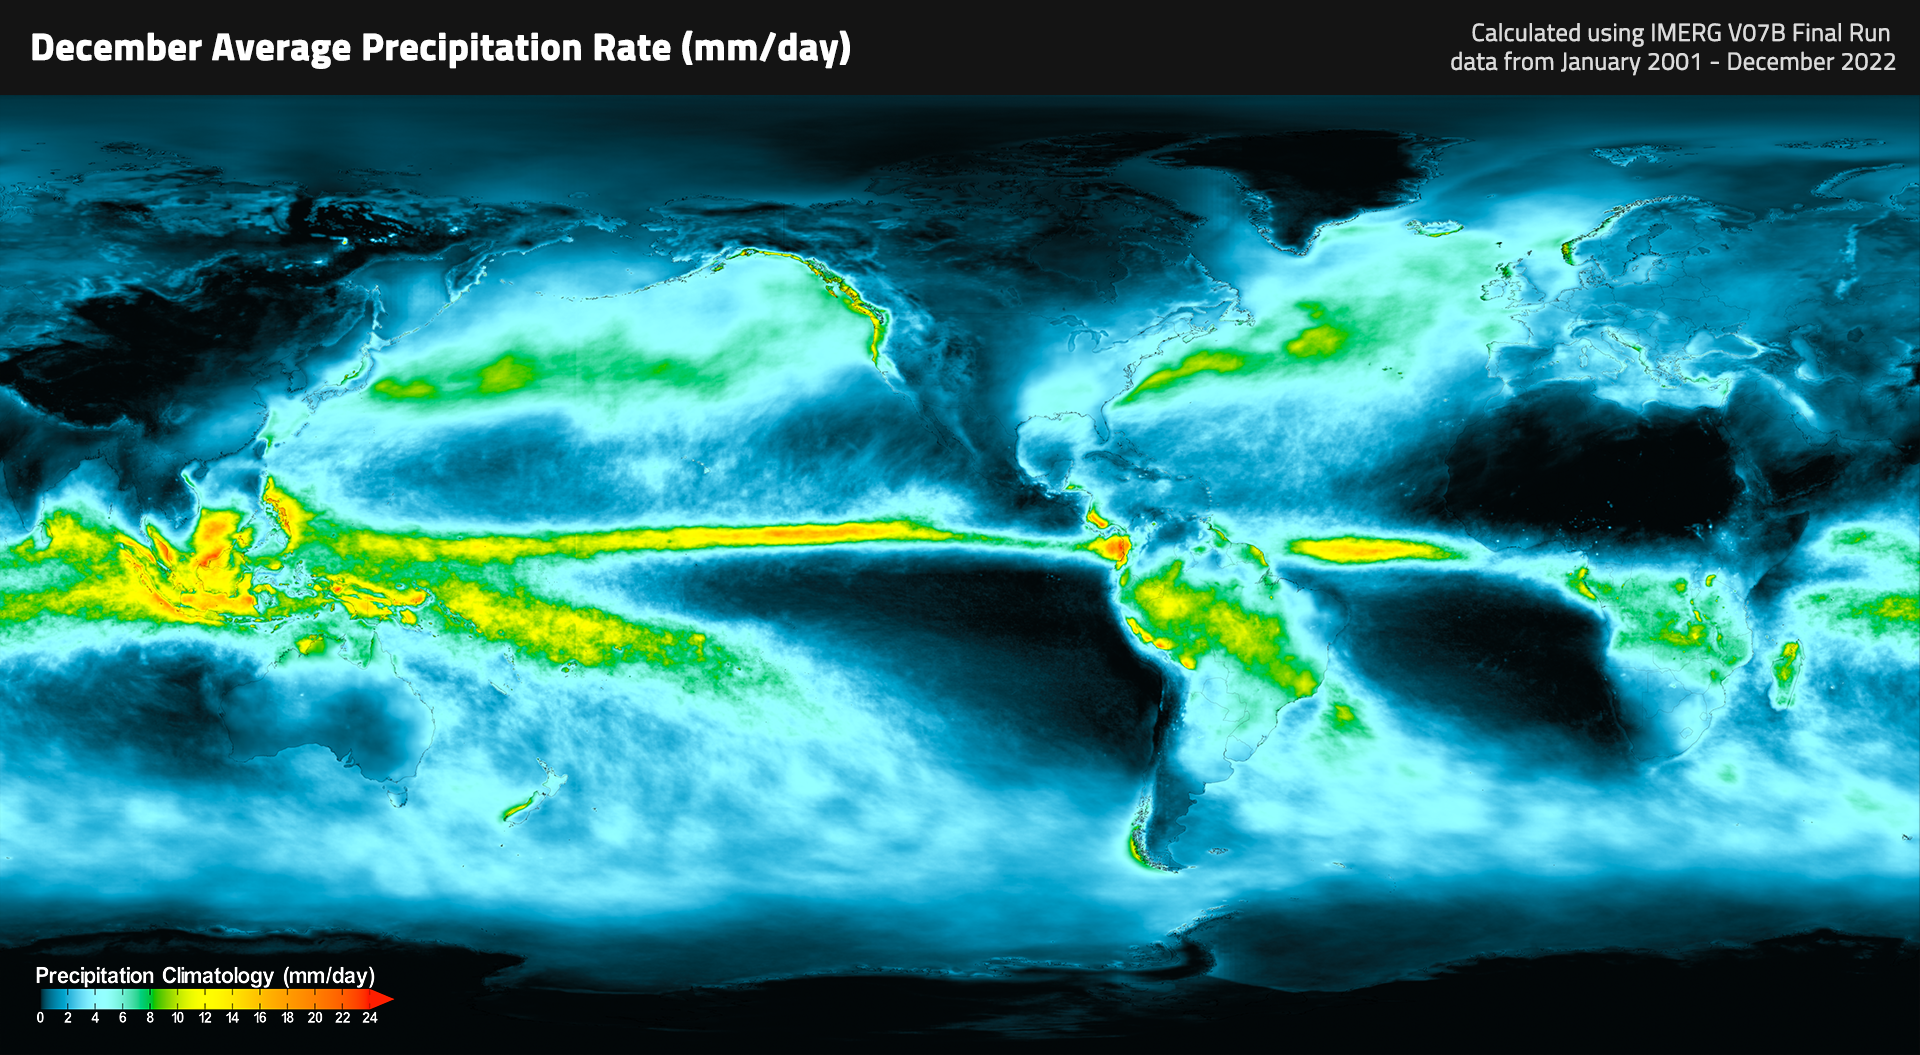
This data visualization cycles through the monthly average precipitation rates, computed using IMERG Final Run data from 2001 - 2022.
- Download this video (right-click -> Save As)
- View additional image formats and downloads from the NASA Goddard Scientific Visualization Studio
Monthly Images
January
March
May
July
September
November
February
April
June
August
October
December
Daily Precipitation Climatology
This animation shows the average amount of precipitation that falls on each day of the year (mm/day), computed from 2001 - 2022.
- Download NetCDF files of the IMERG V06 Final Run Daily Climatology Download this video (right-click -> Save As)
The daily climatology dataset covers January 2001 to December 2018, computed as a trailing 30-day average to reduce the random noise due to isolated big events. Notable features include the annual cycle of the InterTropical Convergence Zone (ITCZ) following the motion of the Sun (with a time lag) over both land and ocean, the seasonal shift of the Asian Monsoon between South Asia in the boreal summer and Australia in the boreal winter, the North American Monsoon in the late boreal summer in northern Mexico and southwestern U.S., and the dry summer/wet winter pattern in the Mediterranean Sea area and the west coast of the U.S.
Diurnal Cycle
The diurnal cycle of precipitation describes the average precipitation over the course of the day. Of the many different weather systems that produces precipitation, one key process is direct heating from the sun. This causes a daily cycle of precipitation that shows up clearly in animations of the diurnal cycle. The strength and timing of the diurnal cycle can vary considerably depending on the geography of the region, particularly in the presence of coastlines and mountains.
The data is transformed from coordinated universal time (UTC) to local solar time (LST) based on its longitude. Therefore, 16:00 LST means that it is approximately 4 p.m. in the afternoon everywhere. This transformation allows us to compare the diurnal cycle between regions that are far apart without having to account for the difference in time zones.
Diurnal cycle of the Contiguous United States in Summer
Download this video (right-click -> Save As)
Driven by the ubiquitous afternoon thunderstorms that form as a result of the build-up of energy from the sun's heat, the southeastern U.S. has a high average precipitation in the late afternoon and early evening. Over the Great Plains, eastward-marching nocturnal storms bring precipitation late at night and in the early morning hours. Over the ocean, the dynamics are different. Over the Gulf Stream, the precipitation reaches a maximum in the early morning. In the Gulf of Mexico, precipitation is highest at noon due to the land-sea breeze.
Diurnal cycle of the Maritime Continent
Download this video (right-click -> Save As)
During the inter-monsoon season from March to May, the heating from the sun plays a strong role in driving precipitation. Over land, thunderstorms form in the afternoon near the coast but later in the evening further inland. Over ocean, precipitation reaches a peak at about midnight over the coastal waters but later in the morning in the open ocean. This intricate pattern in the diurnal cycle of precipitation reflects the complex coastlines and topography of the region, both of which are challenges to global weather and climate models.