Hal Pierce

Tropical Cyclone Errol Near Australia

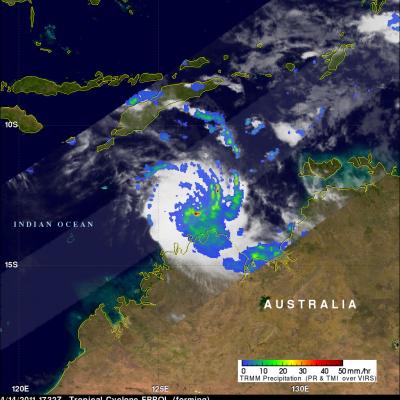
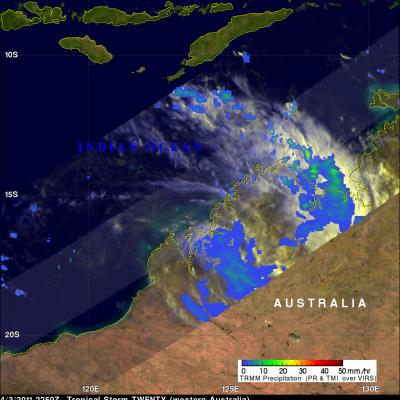
The South Indian Ocean tropical cyclone season is nearing it's end but another tropical cyclone called ERROL has developed northwest of Australia. The TRMM satellite flew over ERROL when it was getting organized on 14 April 2011 at 1732 UTC. The image on the left above shows an analysis of rainfall using data from TRMM's Microwave Imager (TMI) and Precipitation Radar (PR) instruments. The light swath shows the locations of some heavy thunderstorms as TRMM's PR crossed over ERROL's center of circulation. The image on the upper right shows a 3-D image of these thunderstorms made from those radar

TRMM Sees Deadly Rainfall over Thailand

More than 15 people have been killed in Thailand over the past week due to flooding and mudslides caused by extremely heavy rainfall. The Multisatellite Precipitation Analysis (TMPA) analysis above was made using data that were calibrated with TRMM precipitation data. These data are calculated and stored at NASA Goddard Space Flight center and are available within a few hours after being received by satellites. This analysis shows that rainfall for the past week over the Malay Peninsula was particularly extreme with totals of almost 1200 mm (~47 inches). TRMM satellite data revealed that

TRMM Sees Diminished CHERENO (18S)

The TRMM satellite passed directly above the remnants of tropical cyclone CHERENO (18S) in the South Indian Ocean on 22 March 2011 at 0225 UTC. TRMM's Microwave Imager (TMI) and Precipitation Radar (PR) show that CHERENO, although weakened, still had some life and was producing very heavy rainfall of over 50 mm/hr (~2 inches) south-southeast of Reunion Island.

Rainfall Near ARANI Subsides

The image above shows subtropical cyclone ARANI as the TRMM satellite passed over head on 17 March 2011 at 0958 UTC. TRMM Microwave Imager (TMI) and Precipitation Radar (PR) data from that orbit show that moderate to heavy rainfall was only occurring to the southeast of ARANI at that time. TMI and PR rainfall data were overlaid on a combination visible and infrared image that used TRMM Visible and InfraRed Scanner (VIRS) data. Visible low level clouds from this image (shown in shades of yellow) are the only evidence for the location of ARANI's center of circulation. Click here to see earlier

TRMM Over Tropical Cyclone 18S

On 17 March 2011 at 0212 UTC the TRMM satellite passed over tropical cyclone 18S that had formed and was intensifying in the open waters of the South Indian Ocean. 18S was already well organized and TRMM's Precipitation Radar (PR) showed that powerful thunderstorm towers were located near 18S' center of circulation. These towers know as chimney clouds release a lot of energy and can serve to strengthen a tropical cyclone. 18S is expected to attain strong tropical storm intensity with wind speeds of at least 55 kts (~63 mph) in the next three days.

TRMM Sees Strong Thunderstorms in ARANI

The TRMM satellite had another very good view of subtropical cyclone ARANI in the morning light on 16 March 2011 at 1052 UTC. This orbit showed that there were very heavy thunderstorms in the eastern half of the storm. TRMM's Precipitation Radar (PR) showed that some of these powerful storms were reaching to heights of over 14 km (~8.7 miles) above the surface of the south Atlantic Ocean.

Unusual Cyclone forms in South Atlantic

During the daytime on Tuesday 15 March 2011 at 1820 UTC the TRMM satellite flew over a rare cyclone labeled ARANI in the south Atlantic Ocean. ARANI has the appearance of a tropical cyclone but has been classified as a subtropical cyclone. NOAA's Satellite and Information Service classified ARANI as a T1 on the Dvorak intensity scale which would indicate an estimated wind speed of about 29 kts (~33 mph). TRMM's Microwave Imager (TMI) and Precipitation Radar (PR) data were used in the image on the right to show rainfall near ARANI. Tropical cyclones are very rare in the south Atlantic Ocean. In

Analysis of Heavy Rain over the Eastern United States

Although the heaviest rainfall over the past week was in the southern United States, flooding was reported in states from Louisiana to northern New York. The rainfall analysis above was made by merging precipitation data from multiple satellites. This Multisatellite Precipitation Analysis (TMPA) analysis used data products that were calibrated with TRMM precipitation data. These data products are calculated and stored at Goddard Space Flight center and are available within a few hours after being received by satellites. This analysis indicates that the greatest total rainfall for the past week