
TRMM Sees Tropical storm Dorian Forming
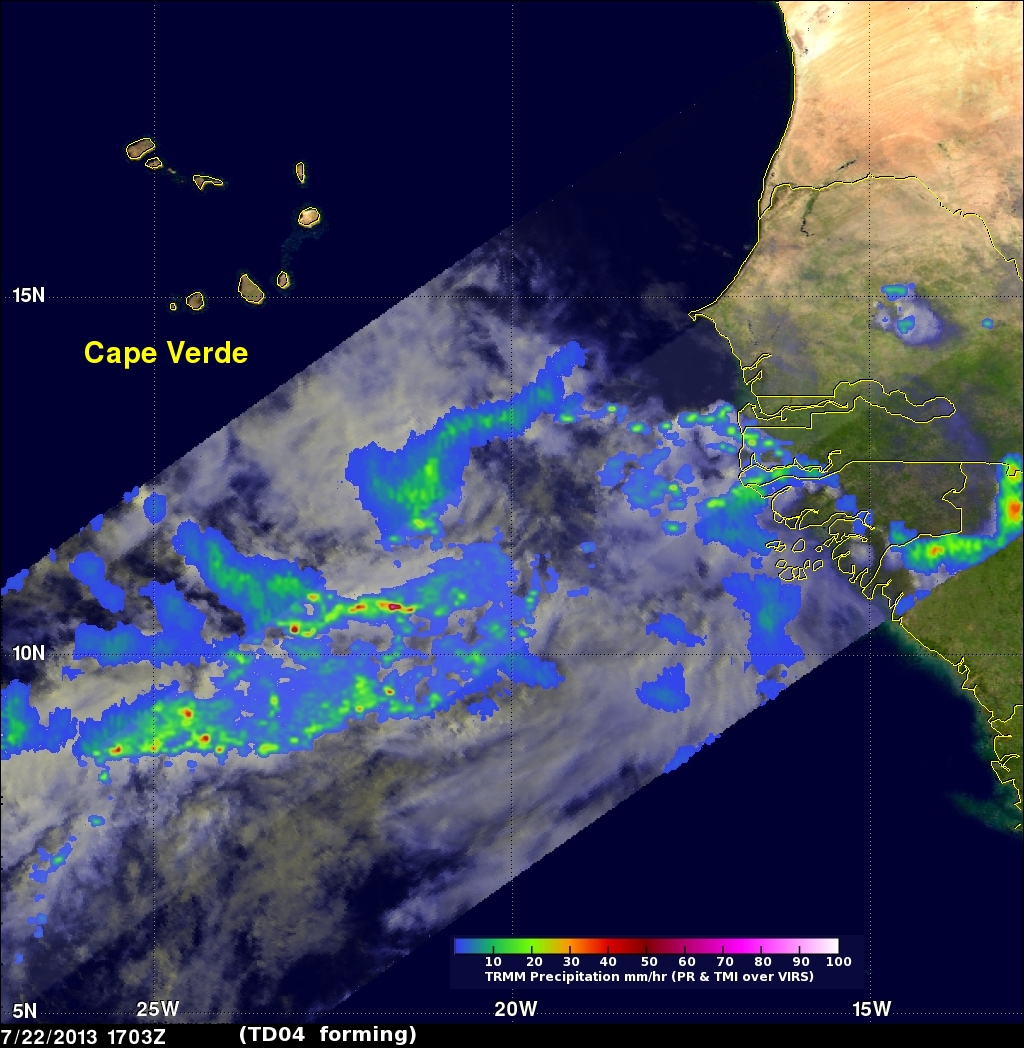
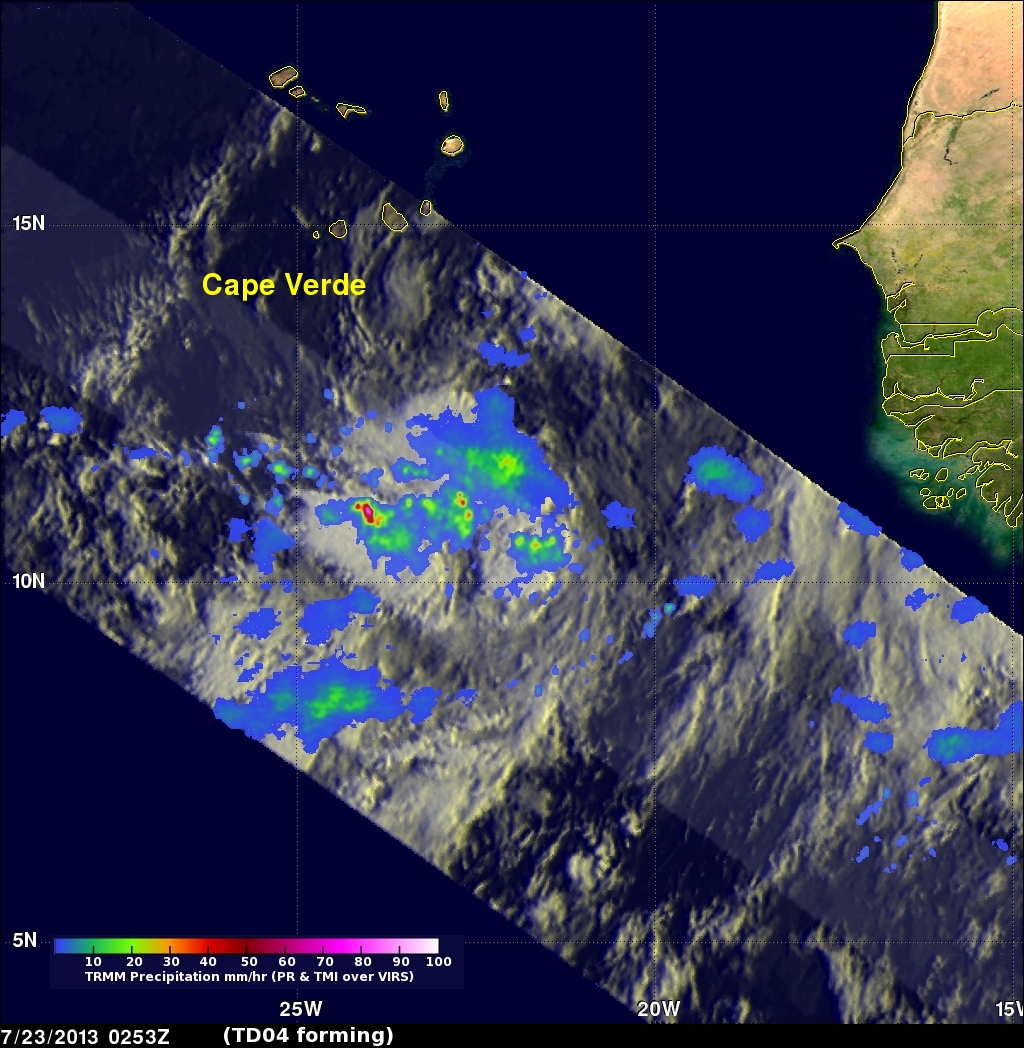
The image on the left used data captured by the TRMM satellite on July 22, 2013 at 1703 UTC when it passed above a tropical wave in the eastern Atlantic Ocean. The tropical wave had moved from Africa into the eastern Atlantic earlier in the day. The TRMM satellite view on the right shows that the tropical wave's organization had greatly improved when data was again collected on July 23, 2013 at 0253 UTC. Analyses of rainfall from TRMM's Microwave Imager (TMI) and Precipitation Radar (PR) are shown overlaid on Visible and InfraRed Scanner (VIRS) data. A combination visible and infrared VIRS image is shown overlaid with precipitation in the early evening 1703 UTC view on the left. An enhanced infrared image alone, from TRMM's VIRS instrument, was used as an underlay in the early morning 0253 UTC view on the right. The area covered by the TRMM PR instrument is shown as a slightly lighter shade.
The image on the left used data captured by the TRMM satellite on July 22, 2013 at 1703 UTC when it passed above a tropical wave in the eastern Atlantic Ocean. The tropical wave had moved from Africa into the eastern Atlantic earlier in the day. The TRMM satellite view on the right shows that the tropical wave's organization had greatly improved when data was again collected on July 23, 2013 at 0253 UTC. Analyses of rainfall from TRMM's Microwave Imager (TMI) and Precipitation Radar (PR) are shown overlaid on Visible and InfraRed Scanner (VIRS) data. A combination visible and infrared VIRS image is shown overlaid with precipitation in the early evening 1703 UTC view on the left. An enhanced infrared image alone, from TRMM's VIRS instrument, was used as an underlay in the early morning 0253 UTC view on the right. The area covered by the TRMM PR instrument is shown as a slightly lighter shade.