Rusty

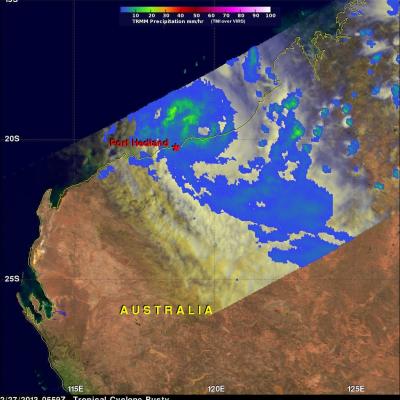
Tropical Cyclone Rusty's Flooding Rainfall

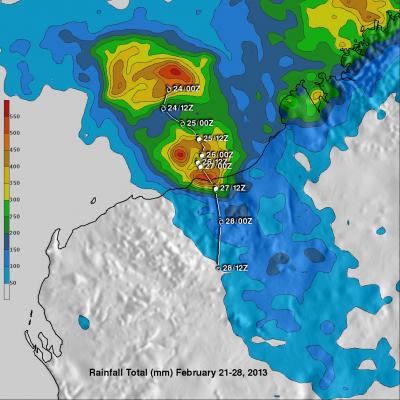
In addition to high winds tropical cyclone Rusty's heavy rainfall caused flooding in north-western Australia. The TRMM satellite's main purpose is the accurate measurement of tropical rainfall around the globe. TRMM is also used to calibrate rainfall estimates from other satellites. The TRMM-based, near-real time Multi-satellite Precipitation Analysis (TMPA) at the NASA Goddard Space Flight Center provides estimates of rainfall over the global Tropics. TMPA rainfall totals in association with tropical cyclone Rusty are shown for the period from February 21-28, 2013. Rusty's approximate 0000Z

Tropical Cyclone Rusty Moves Into Australia

On February 27, 2013 at 0559 UTC The TRMM satellite again saw tropical cyclone Rusty moving toward Australia's coastline north-west of Hedland. A rainfall analysis derived from TRMM's Microwave Imager (TMI) data is shown overlaid on a visible/infrared image from the TRMM Visible and InfraRed Scanner (VIRS). Rusty's eye, surrounded by light to moderate rainfall, was revealed by TRMM's TMI data to be located very near the coastline. Click here to see an animation which fades from the underlying visible/infrared image to the TMI rainfall analysis image. Tropical cyclone Rusty is predicted to

Tropical Cyclone Rusty Heading For Australia

A tropical cyclone called Rusty developed in the Indian Ocean north of north-western Australia's coast on February 24, 2013. The TRMM satellite viewed the intensifying tropical cyclone when it flew over on February 25, 2013 at 0750 UTC. A rainfall analysis from TRMM's Microwave Imager (TMI) and Precipitation Radar (PR) with that orbit is shown overlaid on a visible/infrared image from TRMM's Visible and InfraRed Scanner (VIRS). This analysis showed that Rusty had an extensive area of rainfall surrounding Rusty's very large eye. TRMM PR and TMI instruments found that rain within wide bands of

Powerful Rusty At Australia's Door

Tropical cyclone Rusty's winds had increased to hurricane intensity when the TRMM satellite flew directly above on February 26, 2013 at 0654 UTC. A rainfall analysis derived from TRMM data is shown with the first image. Rain rates in the center of the swath are from the TRMM PR, while those in the outer swath are from the TRMM Microwave Imager (TMI). The rain rates are overlaid on a combination infrared (IR) visible (vis) image derived from the TRMM Visible Infrared Scanner (VIRS). TRMM PR found that the heaviest surface rain was coming down at a rate of over 138mm/hr (~5.4 inches). This