heavy rainfall

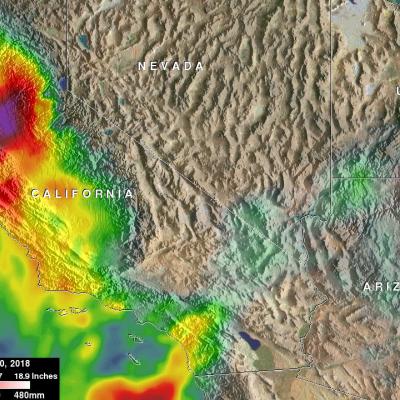
Heavy Rainfall Leads To Deadly California Mudslides JacobAdmin Wed, 01/10/2018
Winter rains falling on recently burned ground triggered deadly mudslides near Santa Barbara, California on the 9th of January. The potential for landslides is shown above. It was generated by the global Landslide Hazard Assessment for Situational Awareness (LHASA) model, a model that combines GPM precipitation data with a global landslide susceptibility map. LHASA gives a broad overview of landslide hazard in nearly real time, but site-specific information should be obtained prior to emergency operations or building projects. At least 15 residents of southern California have been killed by

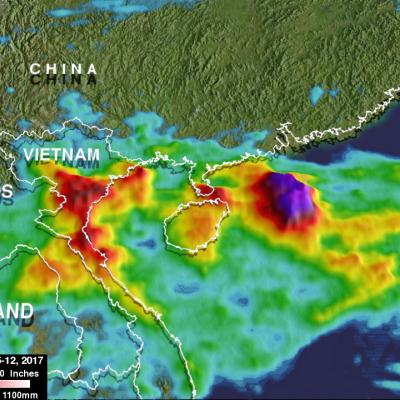
Rainfall In Southeast Asia Analyzed By GPM

Tropical storm Khanun formed northeast of the Philippines on October 12, 2017. The GPM core observatory satellite passed above Khanun on October 13, 2017 (0656 UTC) when maximum sustained wind speeds had reached about 45 kts (~52 mph). Khanun had passed over the northern Philippines and was moving into the South China Sea. The approximate location of Khanun's center of circulation is shown with a red tropical storm symbol. The intensifying tropical storm's rainfall is shown in this image courtesy of data collected by GPM's Microwave Imager (GMI) and Dual-Frequency Precipitation Radar (DPR)

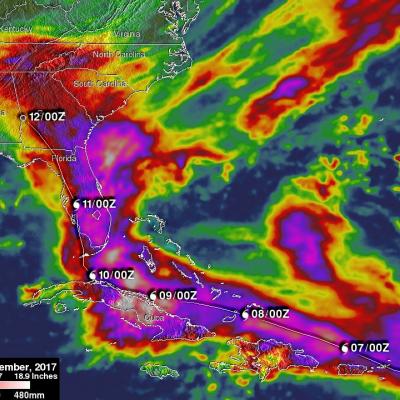
Irma’s Heavy Rainfall Measured With GPM IMERG

Hurricane Irma dropped extremely heavy rain at times during it’s trek from near the Cape Verdi Islands through the northern Leeward islands, Cuba and the southeastern United States. Over 16 inches (406 mm) of rain was reported in Guantanamo, in the easternmost province of Cuba, as the category five hurricane battered the country. Almost 16 inches (406 mm) of rain was also reported at Fort Pierce on the eastern side of Florida. Charleston, South Carolina reported 6 inches (152.4 mm) of rain in 24 hour. This heavy rainfall plus storm surge flooding caused the worst flooding in Charleston since
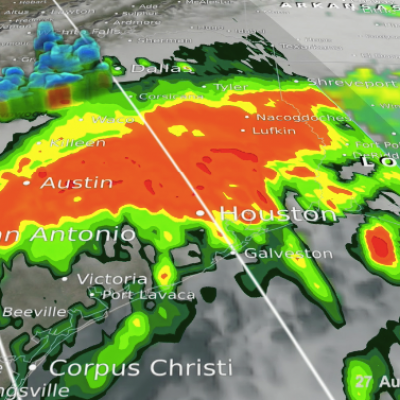
GPM Captures Hurricane Harvey's Rainfall
Music: "Whirlpool," Michael Jan Levine, Killer Tracks The Global Precipitation Measurement (GPM) Core Observatory captured these images of Hurricane Harvey at 11:45 UTC and 21:25 UTC on the 27th of August nearly two days after the storm made landfall as it was meandering slowly southeast at just 2 mph (~4 kph) near Victoria, Texas west of Houston. The image shows rain rates derived from GPM's GMI microwave imager (outer swath) and dual-frequency precipitation radar or DPR (inner swath) overlaid on enhanced visible/infrared data from the GOES-East satellite. Harvey's cyclonic circulation is...

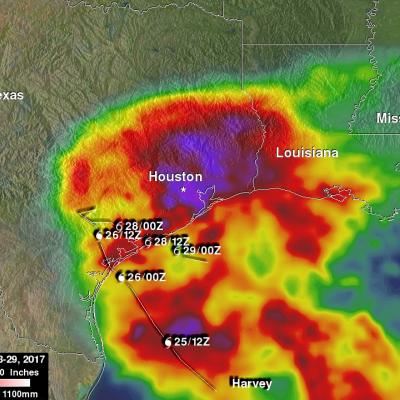
NASA's IMERG Shows Rainfall Accumulation Along Harvey's Track

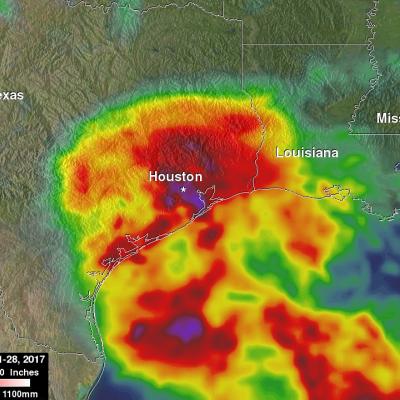
Total rainfall estimates from NASA's Integrated Multi-satelliE Retrievals for GPM (IMERG) data are shown here for the period from August 23-29, 2017. During this period hurricane Harvey dropped heavy rainfall as it moved through the Gulf Of Mexico and stalled over Texas. It has been reported that Harvey dropped over 40 inches (1016 mm) of rain over southeastern Texas during this period. Hurricane Harvey's locations and track are shown here overlaid in white IMERG Data are produced using data from the satellites in the GPM Constellation, and is calibrated with measurements from the GPM Core
Harvey Hits Texas, Unleashes Major Flooding
Despite its earlier demise, after rejuvinating over the warm waters of the Gulf of Mexico, Hurricane Harvey has become a major weather maker as it unleashes historical flooding over parts of coastal Texas. Harvey began on the 17th of August as a weak tropical storm about 250 miles (~400 km) east of Barbados in the Leeward Islands. Over the next two days, Harvey continued moving steadily westward passing through the Leeward Islands as a still weak tropical storm and entered into the east central Caribbean. On the 19th, Harvey succumbed to the effects of northeasterly wind shear over the central...

GPM's Radar Measures Intense Rain In Hurricane Harvey

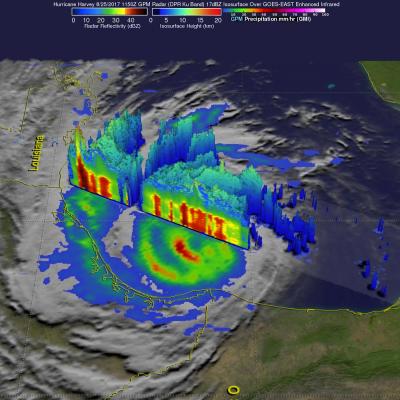
Hurricane Harvey's has continued to intensify today as it moves toward the Texas coast. Bands of rain from the hurricane were affecting the Gulf coast from Louisiana to southeastern Texas. The Global Precipitation Measurement (GPM) mission core observatory satellite had another look at hurricane Harvey on August 25, at 7:50 AM CDT (1150 UTC) as it was menacing the Texas gulf coast. GPM's Dual-Frequency Precipitation Radar (DPR) instrument scanned precipitation within powerful storms wrapping around the eastern side of the hurricane. DPR found that intense storms in that area were dropping rain
Heavy Downpours Cause Flooding In The Midwest JacobAdmin Fri, 07/14/2017
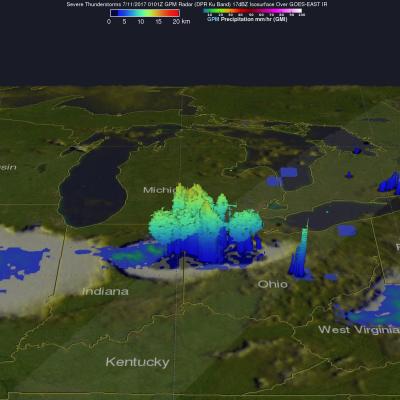
Heavy rain has resulted in significant flooding in the Midwest during the past week. Water flowing into the Fox River in northeastern Illinois caused serious flooding in that area. Central Indiana and central Ohio have also had remarkable flooding. NASA's Integrated Multi-satelliE Retrievals for GPM (IMERG) data were used to show estimates of rainfall accumulation in the Midwest during the period from July 7-14, 2017. This analysis indicates that parts of Wisconsin, Illinois, Indiana and Ohio had the highest rainfall totals during the period with over 6 inches (152.4 mm) of rain being seen in

Bangladesh's Heavy Rainfall Examined With IMERG

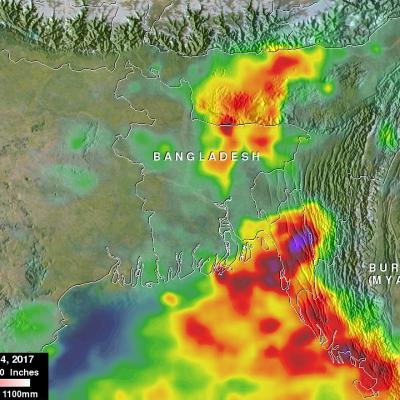
At least 156 people in Bangladesh were killed during the past week by landslides and floods caused by heavy rainfall. Monsoon rainfall has been especially heavy over this area that includes southeastern Bangladesh, northeastern India and western Burma (Myanmar). This disaster follows quickly on the heels of deadly cyclone Mora which hit the same area a couple weeks ago. This rainfall analysis was made at Goddard Space Flight Center using NASA's near-real time Integrated Multi-satelliE Retrievals for GPM (IMERG) data. Those IMERG data were assembled during the period from June 12-14, 2017. The