Ana

IMERG Captures Rainfall from Tropical Cyclone Ana in Fiji
NASA combined data from multiple satellites to estimate the rainfall from Tropical Cyclone Ana in the Southwest Pacific Ocean amid an ongoing Madden-Julian Oscillation (MJO) event. The Madden-Julian Oscillation is a 20 to 90 day pattern of alternating wet and dry conditions that often begins in the tropical Indian Ocean and moves eastward into the Pacific. This animation shows rainfall rates (blue/yellow shading) and rainfall accumulations (green shading) at half-hourly intervals from January 26 - February 2, 2021, using NASA's IMERG algorithm, overlaid on shades of white/gray from NOAA

Ana Becomes First 2015 Atlantic Tropical Storm & Weakens Ashore

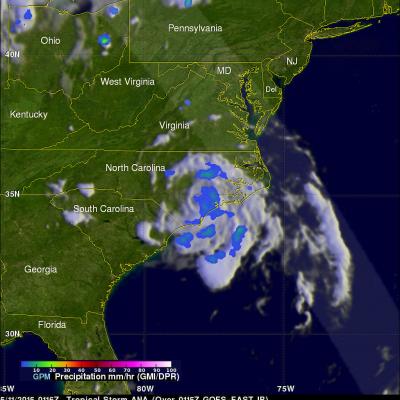
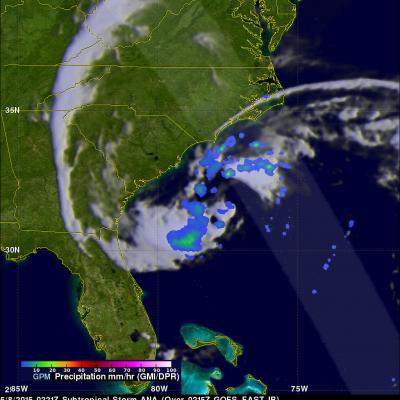
On May 9, 2015 at 1626 UTC ( 12:26 PM EDT) the GPM satellite flew over when Ana was making the change from subtropical storm to tropical storm. Convective storms near the inner-core region were warming the center of the storm with heat generated by condensation. GPM's Microwave Imager (GMI) measured rain falling at at rate of over 58.7 (2.31 inches) per hour in these convective storms near ANA's center. The lighter swath to the west of Ana's center shows the area viewed by GPM's Ku/Ka-band Dual-frequency Precipitation Radar (DPR). On Sunday morning (May 10, 2015) Tropical storm ANA dropped

GPM Flys Above Subtropical Storm Ana

During the past few days subtropical storm Ana was developing off the southeastern coast of the United States. Yesterday and today the GPM core observatory satellite had two good views of subtropical storm Ana. The image above shows the developing subtropical storm on May 7, 2015 at 1636 UTC (12:36 PM EDT). This GPM pass occurred a little over 10 hours before the National Hurricane Center (NHC) issued their first advisory at 0300 UTC ( 11:00 PM EDT). This image shows rainfall derived from GPM's Ku/Ka-band Dual-frequency Precipitation Radar (DPR) and a multi-channel GPM Microwave Imager (GMI)

Tropical Storm Ana Still Vigorous

The TRMM satellite flew over tropical storm ANA on October 22, 2014 at 1935 UTC (about 8:30 AM local time). ANA formed over ten days ago but after moving to the northwest of the Hawaiian islands the tropical storm was shown to be still vigorous. A rainfall analysis from TRMM's Microwave Imager (TMI) revealed an area near ANA's center of circulation where rain was falling at a rate of over 40 mm (about 1.6 inches) per hour. The Joint Typhoon Warning Center (JTWC) predicts that ANA will maintain tropical storm intensity for the next five days while moving over open waters toward the northwest.

Hurricane Ana Bypasses But Soaks Hawaiian Islands

Fortunately for Hawaii hurricane Ana passed to the south of the islands. This meant that for the third time this year the Hawaiian Islands were spared destructive hurricane force winds. However, Ana caused occasionally heavy rain over much of the area and was responsible for flash floods on the the big island (Hawaii). This analysis shows estimated rainfall totals during the period when hurricane Ana formed on October 13, 2014 and moved west of the Hawaiian Islands on October 21, 2014. The TRMM-based, near-real time Multi-satellite Precipitation data (TMPA) analysis is used to monitor rainfall

Ana Threatens Hawaiian Islands

Tropical storm Ana, that formed southeast of the Hawaiian islands on October 13, 2014, will be the third tropical cyclone to threaten the island chain this year. Hurricane Iselle weakened to a tropical storm and passed over the island of Hawaii on August 8, 2014. Hurricane Julio was still a hurricane when it veered to the northeast of the islands on August 10, 2014. Tropical storm Ana was recently seen by the TRMM satellite on October 16, 2014 at 2224 UTC and October 17, 2014 at 1313 UTC. Rainfall from these two orbits are shown overlaid on GOES-WEST visible and infrared images received on the