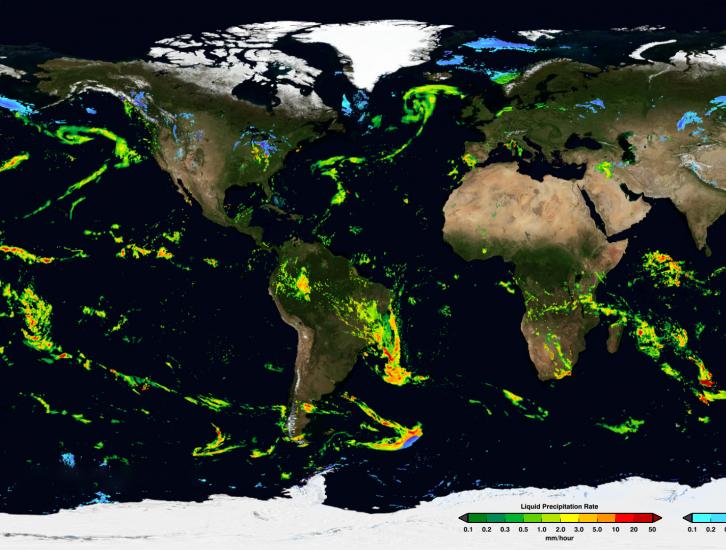
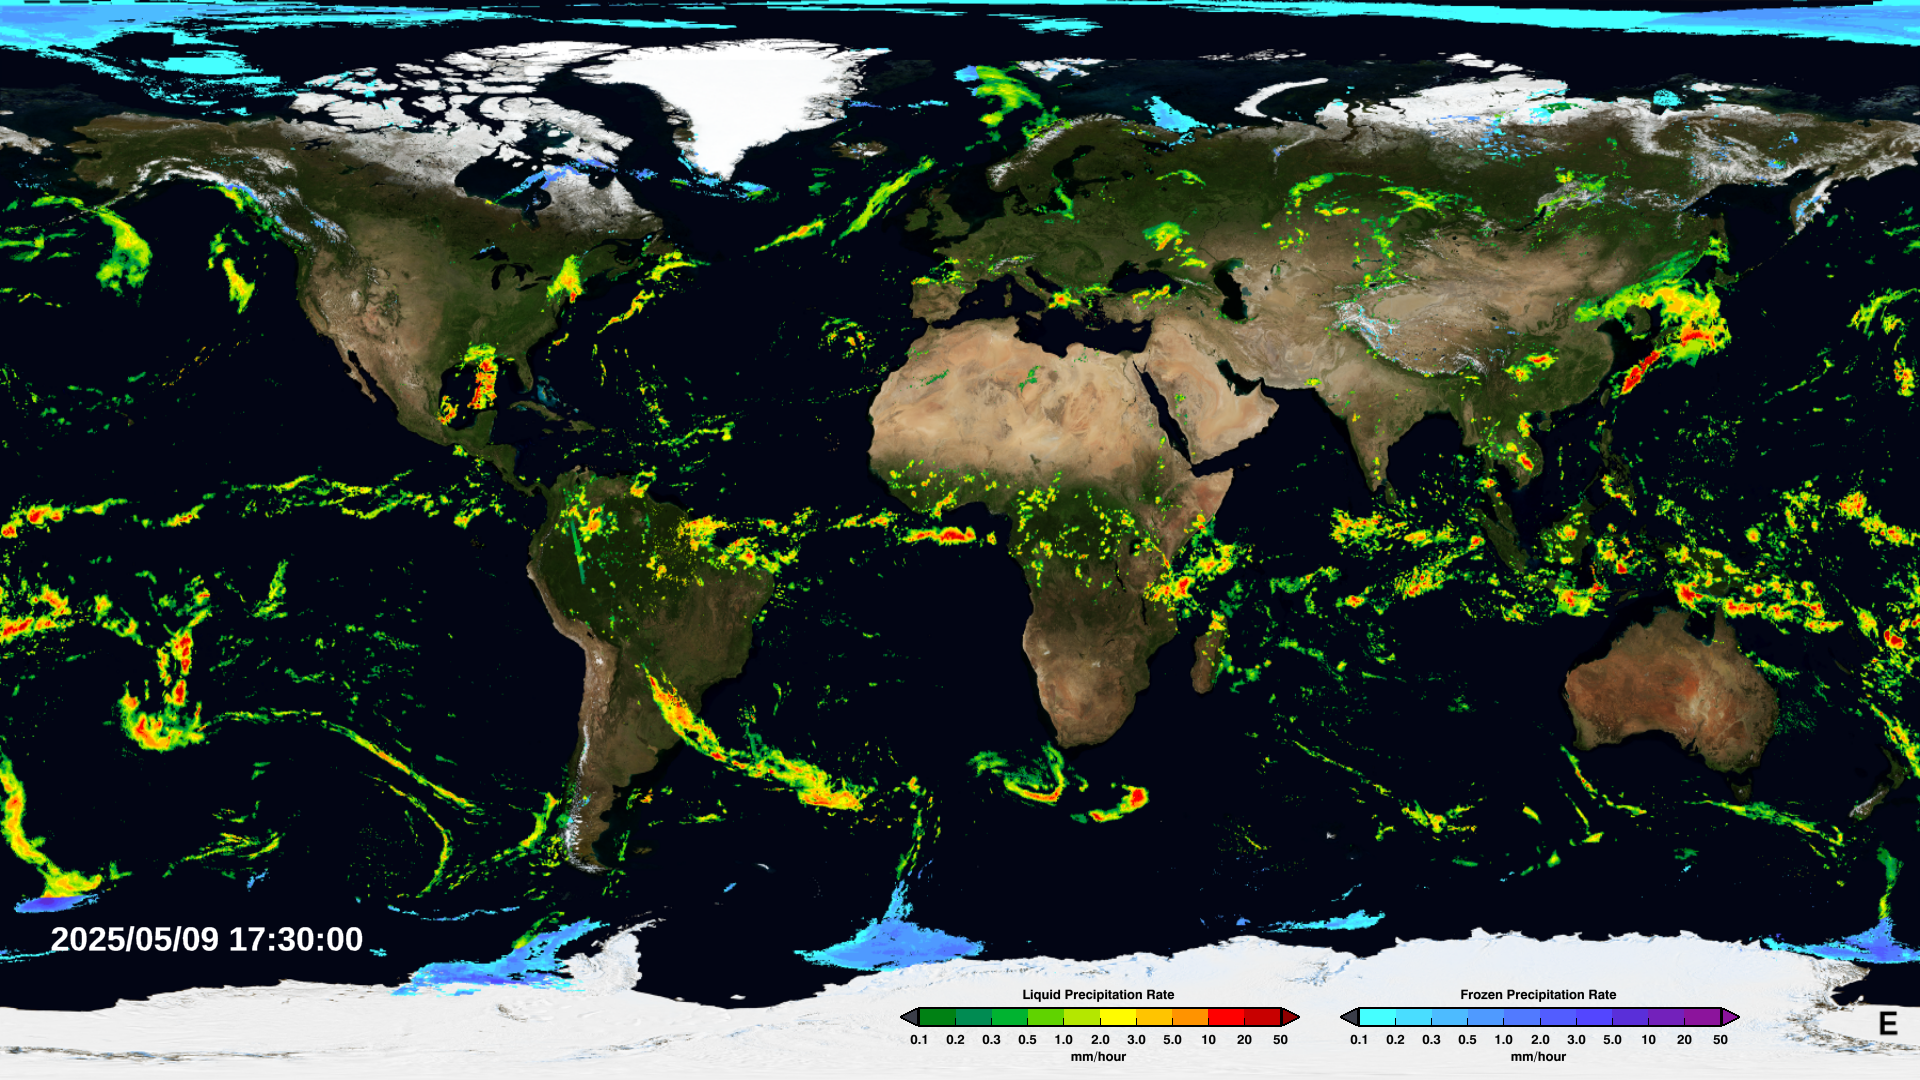
IMERG Early Run Example January 24th, 2020

IMERG: Integrated Multi-satellitE Retrievals for GPM

NASA’s Integrated Multi-satellitE Retrievals for GPM (IMERG) algorithm combines information from the GPM satellite constellation to estimate precipitation over the majority of the Earth's surface.  IMERG is particularly valuable over areas of Earth's surface that lack ground-based precipitation-measuring instruments, including oceans and remote areas. 

IMERG fuses precipitation estimates collected during the TRMM satellite’s operation (2000 - 2015) with recent precipitation estimates collected by the GPM mission (2014 - present) creating a continuous precipitation dataset spanning over two decades. This extended record allows scientists to compare past and present precipitation trends, enabling more accurate climate and weather models and a better understanding of Earth’s water cycle and extreme precipitation events. IMERG is available in near real-time with estimates of Earth’s precipitation updated every half-hour, enabling a wide range of applications to help communities around the world make informed decisions for disasters, disease, resource management, energy production, food security, and more.

Sections

Popular IMERG Data Downloads & Visualization Tools

IMERG Early, Late and Final Run data is made available in multiple data formats with different types of processing to serve the needs of the data user community. Below are some of the most popular datasets, formats and tools for downloading and visualizing IMERG data.

Please consult the GPM Data Directory for a complete list of GPM data products and documentation. 

  • Download URL: https://jsimpsonhttps.pps.eosdis.nasa.gov/imerg/gis/
  • Longer latency than Early Run but a higher quality product. 
  • Click here to register for the PPS FTP
  • Read documentation for using IMERG GeoTIFF + Wordfiles
  • Files located in ./[yyyy]/[mm]
  • 30 minute, 3 hour, 1 day, 7 day, and 1 month files are all available in the same directory, with the timespan indicated within the filename (e.g. 3B-HHR-L.MS.MRG.3IMERG.20200516-S083000-E085959.0510.V06B.3hr.tif is a 3 hour file) 
  • 1 month files are located in the folder corresponding to the first day of each month.
  • Precipitation values are scaled by a factor of x10 (0.1mm) for 30 minute, 3 hour, 1 day, 3 day and 7 day files, and are scaled by a factor of x1 (1mm) for 1 month files.

IMERG Frequently Asked Questions

What are the differences between IMERG Early, Late, and Final Runs, and which should be used for research?

The main difference between the IMERG Early and Late Run is that Early only has forward propagation (which basically amounts to extrapolation forward in time), while the Late has both forward and backward propagation (allowing interpolation).  As well, the additional 10 hours of latency allows lagging data transmissions to make it into the Late run, even if they were not available for the Early (see below). 

There are two possible factors which contribute to differences in the IMERG Late Run and Final Run datasets:

  1. The Late Run uses a climatological adjustment that incorporates gauge data. In Versions 05 and 06 no adjustment has been applied.  In Version 04 this was a climatological adjustment to the Final run, which includes gauge data at the monthly scale. For Version 03  the TRMM V7 climatological adjustment of the TMPA-RT to the production TMPA was used (which includes gauge at the monthly scale) because this at-launch algorithm didn't yet have any Late and Final data from which to build the climatological adjustment.  The Final run uses a month-to-month adjustment to the monthly Final Run product, which combines the multi-satellite data for the month with GPCC gauge.  Its influence in each half hour is a ratio multiplier that's fixed for the month, but spatially varying.
  2. The Late Run is computed about 14 hours after observation time, so sometimes a microwave overpass is not delivered in time for the Late Run, but subsequently comes in and can be used in the Final.  This would affect both the half hour in which the overpass occurs, and (potentially) morphed values in nearby half hours.

The satellite sensor difference could be examined by comparing the satellite sensor data field in the Late and Final Run datasets for each half hour.  Since the gauge adjustment is a constant multiplier, a time series should show a constant ratio between the Late and the Final Runs for the entire month (except for cases where the satellite sensor is changing, just as for the ocean).

We always advise people to use the Final Run for research.  The vast majority of grid boxes have fairly similar Late and Final values, so it makes sense to stick to metrics that are more resistant to occasional data disturbances.  Extreme values are more sensitive to these details; medians, means, and root-mean square difference are less sensitive. 

What Determines the Latency of IMERG?

1. Most of the low-orbit microwave satellites downlink their data once or twice an orbit (which is about 90 minutes long) to the operating agency. [Except GMI comes down in 5-min. granules.] The agencies compute the Level 1B files, package them, and ship the data around. PPS gets all the NOAA and EUMETSAT data through NOAA, DMSP from NRL Monterey, and the Japanese AMSR2 through NASA, SAPHIR (now intermittently and generally not in near-real time) through ISRO, and GPM DPR and GMI within GPM. The global merged geo-IR data are assembled by NOAA/NWS/CPC, and the Precipitation Processing System (PPS) accesses GEOS FP forecasts through the Goddard NCCS and Autosnow from NOAA. By about 3 hours after observation time the geo-IR and about 85% of the microwave (depending on how systems feel that day) have arrived at PPS. PPS converts the microwave data to precip estimates and computes the IMERG Early Run, which only uses forward propagation morphing (plus IR in the Kalman filter) by about 4 hours after observation time.  [One subtle point is that the IR half-hour data fields come in pairs, so both halves of the hour are processed together, meaning the second half hour almost always has shorter latency than the first. Another is that IMERG uses forecasts to get the analysis of vertically integrated vapor, which is what IMERG V06 uses to estimate system motion for the morphing. So, hitches in delivery of the latest GEOS FP are not a big deal – IMERG just uses the most recent forecast sequence, whatever that is.]

2. To compute the IMERG Late Run, which entails both forward and backward propagation morphing (plus IR), processing has to wait long enough that the following microwave overpass has a chance to occur and then follow the delivery chain described above. So, PPS waits 11 hours to capture a reasonably complete set of "next overpass" data, and then start processing. The nominal latency stated in the documentation is 14 hours, but it's more like 12 in recent data.

3. The IMERG Final Run uses MERRA2 for the vertically integrated vapor, GPCC monthly Monitoring Analysis for gauge, and revised precipitation retrievals that depend on ERA-5 (and ERA-I up through mid-2019).  The pacing items are the GPCC and ERA-5, usually giving a latency of about 3.5 months.

How do the various forms of precipitation map into the IMERG "probabilityLiquidPrecipitation" data field?

IMERG provides a data field that estimates the probability that the retrieved precipitation amount is “liquid”, which is defined to include “mixed” (liquid and solid) precipitation.  In retrospect the field name should have been “ice”, but “liquid” had already been set.  The rational is that mixed precipitation is very rare and transient, so it should be lumped with either “liquid” or “ice”.  Furthermore, the primary effects of “ice” are to 1) prevent the falling precipitation from immediately entering the hydrological system (until it melts), and 2) to create (potentially) dangerous travel conditions.  “Mixed” typically ends up not creating either of these effects, so lumping it with “liquid” seems appropriate. 

Even given this basic definition, there are numerous forms of precipitation, and it might not be obvious how they end up being classified in IMERG.  The key fact is that the phase is computed diagnostically at present, based on work by Guosheng Liu (Florida State University) and students.  The Liu scheme uses data from a numerical model or model analysis to compute a “specification”, without reference to the satellite data, including whether or not IMERG estimates that precipitation is occurring, or even possible to estimate.  Thus, probabilityLiquidPrecipitation (pLP) is a globally complete field whenever the relevant model data exist.  An additional factor is that there is a conceptual difference between how the half-hourly phase is computed and how phase is defined in this probability framework for the monthly data.  We will handle the half-hourly first, for which the Liu specification equation is directly relevant.

Liu determined that the primary factor for phase is the surface wet bulb temperature (Tw), a combination of temperature and humidity, with small contributions from the low-altitude Tw lapse rate and the surface pressure, and with systematic differences between ocean and land areas.  In practice, the fitted probability as a function of Tw is converted to separate look-up tables for ocean and land.

Typical results for different forms of precipitation are:

  • Rain:  Ordinary falling liquid typically happens for Tw>0°C, so pLP is high.
  • Freezing Rain:  Liquid that freezes upon contact with the Earth's surface typically falls in Tw<0°C, so pLP is low.
  • Snow, ice pellets, snow pellets:  These frozen hydrometeors occur around or below Tw<0°C, so pLP varies from around 50% to very low.
  • Sleet:  Frozen droplets (U.S. definition) typically fall in Tw<0°C, so pLP is usually below 50%.
  • Mixed snow and rain; falling slush:  The mixed category is likely to occur around the pLP=50% mark.  If one uses 50% as a liquid/solid threshold, that implies that mixed cases will end up in both categories, depending on the details.
  • Hail:  Hail typically occurs when the surface air temperature is well above freezing (i.e., on summer afternoons).  Thus, pLP is very high.  But, hail is even rarer than mixed and unlikely to be correctly specified in this scheme, and anyway, in such conditions it rapidly melts and so is properly lumped into "liquid".
  • Dew and frost:  These phenomena are not forms of precipitation.  They are liquid or solid water that condenses directly at the Earth's surface.  For this reason, any amount of surface accumulation due to dew or frost is not included in the IMERG precip estimate.

As the time interval for the data values lengthens, it becomes increasingly likely that both liquid and solid might have fallen, at which point the meaning of pLP should change to “what fraction of the estimated precipitation amount fell as liquid or mixed?”  This is the definition of pLP for both the monthly IMERG Final Run pLP and the set of GIS IMERG files (TIFF+WorldFile) providing estimated accumulations longer than three hours.

What are the IMERG variables in Giovanni?

The following table provides a quick reference for the IMERG variables that can be visualized using Giovanni.

Product

Variable and Description

GPM_3IMERGHHE

30-min averaged data

Merged microwave-only precipitation estimate [Final]

Precipitation estimates from combining microwave data from the GMI, TMI, and other partner instruments.

Random error for gauge-calibrated multi-satellite precipitation [Final, Early, Late]

This is an estimate of the non-systematic component of the error. The exact variable name depends on the product, but all begin with "Random error..."

Microwave satellite observation time [Final]

Observation time of the microwave precipitation estimates given as minutes from the beginning of the current half-hour.

Microwave satellite source identifier [Final]

This is an integer between 0 and 24 that corresponds to the instrument from which the microwave precipitation estimate was taken. See *3IMERGHH data fields* in the Integrated Multi-satellitE Retrievals for GPM (IMERG) Technical Documentation 

Weighting of IR-only precipitation relative to the morphed merged microwave-only precipitation estimate [Final]

This is the weighting of the infrared data in the final merged estimate, given in percent. Zero means either no IR weighting or no precipitation.

IR-only precipitation estimate [Final]

This is the microwave-calibrated infrared precipitation estimate.

Multi-satellite precipitation estimate with (climatological) gauge calibration [Final, Early, Late]

This is the precipitation estimate that is calibrated with monthly gauge data for the Final Run. This variable is recommended for most users. Note: The gauge calibration used in Early and Late would be climatological, but in V06 no calibration is applied in either Early or Late.

Multi-satellite precipitation estimate [Final]

This is the precipitation estimate that has not been calibrated with gauge data.

Accumulation-weighted probability of liquid precipitation phase [Final]

This is the probability of liquid precipitation. The probabilities are calculated globally regardless of whether precipitation is actually present


GPM_3IMERGM

1 month averaged data

Weighting of observed gauge precipitation relative to the multi-satellite precipitation estimate

This is the percent weighting of the surface gauge data.

Merged satellite-gauge precipitation estimate

This is the precipitation estimate that has been calibrated with gauge data. This variable is recommended for most users.

Accumulation-weighted probability of liquid precipitation phase

This is the probability of liquid precipitation. The probabilities are calculated globally regardless of whether precipitation is actually present.

Random error for merged satellite-gauge precipitation

This is an estimate of the non-systematic component of the error.

What is the difference between the global (90°N-S) and full (60°N-S) coverage for IMERG?

Compared to previous versions, Version 06 IMERG introduces additional coverage at the high latitudes for the precipitation fields in all Runs -- Early, Late, and Final.  IMERG continues to use a merged geosynchronous infrared brightness temperature analysis to provide IR-based precipitation estimates.  The requisite analysis (provided by NOAA/NWS/Climate Prediction Center) covers the latitude band 60°N-S, so a "full" IMERG analysis is possible there.  At higher latitudes (in both hemispheres) IR-based estimates cannot be included, so the coverage in the complete precipitation fields is "partial" -- limited to gridboxes for which there is no snow/ice on the surface.  Some of the other data fields, specifically the merged microwave estimates and the precipitation phase, are provided for the entire globe.

How important are surface precipitation gauges in combined satellite-gauge data sets?

Q1: How closely should the monthly satellite-gauge combined precipitation datasets follow the gauge analysis?

A1: The combined precipitation research team at Goddard has major responsibility for the Global Precipitation Climatology Project monthly Satellite-Gauge combined product, the Tropical Rainfall Measuring Mission (TRMM) Multi-satellite Precipitation Analysis (TMPA) 3B43 monthly product (previously), and the IMERG Final Run monthly product.  In each case the multi-satellite data within the product are averaged to the monthly scale and combined with the Global Precipitation Climatology Centre's (GPCC) monthly surface precipitation gauge analysis (see https://www.dwd.de/EN/ourservices/gpcc/gpcc.html).  In each case the multi-satellite data are adjusted to the large-area mean of the gauge analysis, where available (mostly over land), and then combined with the gauge analysis using a simple inverse estimated-random-error variance weighting.  In all three data sets the gauge analysis has an important or dominant role in determining the final combined value for grid boxes in areas with "good" gauge coverage.  Regions with poor gauge coverage, such as central Africa have a higher weight on the satellite input.  The oceans are mostly devoid of gauges and therefore mostly lack such gauge input.  Isolated island stations are deleted from the GPCC gauge analysis before use because they are usually not representative of the surrounding ocean, and frequently not even the island as a whole.

Q2: How closely related are the short-interval multi-satellite precipitation datasets to the monthly satellite-gauge combined precipitation datasets?

A2: The short-interval GPCP is the One-Degree Daily (1DD), the short-interval TMPA is 3B42 (which is 3-hourly), and the short-interval IMERG is the half-hourly.  In each case the short-interval data are adjusted with a simple, spatially varying ratio to force the multi-satellite estimates to approximately average up to the corresponding monthly product, although with controls on the ratios to prevent unphysical results.  Thus, monthly-average values for the short-interval data should be close to the mean values for the monthly datasets, which the developers consider more reliable than the short-interval datasets.  In fact, compared to datasets that lack the adjustment to the monthly satellite-gauge estimates, the 1DD, 3B42, and IMERG Final half-hourly datasets tend to score better at timescales longer than a few days.  This is presumably because the random error begins to cancel out as more samples are averaged together, while the bias error remains. 

As an example, see:

Bolvin, D.T., R.F. Adler, G.J. Huffman, E.J. Nelkin, J.P. Poutiainen, 2009:  Comparison of GPCP Monthly and Daily Precipitation Estimates with High-Latitude Gauge Observations.  J. Appl. Meteor. Climatol., 48(9), 1843–1857.

How is the intensity of precipitation distributed within a given data value in IMERG?

In the previous TMPA data set, each data value provided a precipitation rate based on one (or perhaps two) satellite snapshots during the TMPA’s 3-hour analysis period. IMERG values are based on a single microwave snapshot during its half-hour analysis period, or a morphed/Kalman filter interpolation if no microwave values are available.  The values are expressed in the intensive units mm/hr; it is usually best to assume that this rate applies for the entire half-hour period.  If you wish to regrid to a finer time and/or space grid, note that many interpolation schemes have the property of suppressing maxima in precipitation and expanding rain events into neighboring zero-amount periods, so it is critical that you examine this issue and state what scheme was used in documentation and papers. 

How are the TMPA and IMERG algorithm designs the same and different?

Both TMPA and IMERG use a constellation of passive microwave satellites, and within the general umbrella groups of “sounder” and “imager” the inputs are much the same, although at the end of the TRMM era the TMPA was not upgraded to include the newer satellites. The direct inputs of the TMI and GMI are swamped by the amount of data from the rest of the microwave sensors, so the absence of TMI in the last 4.5 years of TMPA was not a major problem. At the back end of the multi-satellite algorithms, both TMPA and IMERG use the same scheme for combining satellite data with the GPCC analysis, although IMERG uses the GPCC Final analysis up through 2018, which tends to be more accurate than the GPCC Monitoring analysis that the TMPA used for the last ~9 years. What’s different? The algorithms for the Combined products are very different (2B31 for TMPA and CORRA for IMERG), and that is what provides calibration. The GPROF algorithm has been upgraded for use in IMERG – still Bayesian, but with the libraries of profiles sourced and organized differently. The IR scheme has shifted from VAR to PERSIANN-CCS – very different approaches. Compared to the simple chunking of data into 3-hour intervals in TMPA, note the massive amount of time spent in IMERG on morphing and the Kalman filter. The goal is two-fold:

  1. Provide a finer time resolution so that system evolution is more accurately captured, compared to the 3-hour interval in TMPA. This improved evolution not only provides morefrequent data values, but it should also make the IMERG time averages (such as daily) more accurate, since precipitation changes so rapidly in space and time.
  2. Reduce the use of IR estimates, which have low quality, by time-interpolating the microwave estimates, which have better quality. The hard part here is that the interpolation has to be done in a quasi-Lagrangian framework because the rain systems move. So, IMERG’s morphing/Kalman framework is intended to minimize the IR contribution, even though IR is still seen as necessary in regions with long microwave gaps.

Please view the document The Transition in Multi-Satellite Products from TRMM to GPM (TMPA to IMERG) for further details.

In what sense is the entire record for each Run (Early, Late, Final) processed “consistently”?

The entire record for each Run (Early, Late, or Final) is computed with the same version of processing, with the same input steams specified for that Run.  The data that are processed afresh are called “Initial Processing” (IP) and those that processed after the fact when the new version starts are called “retrospective processing” (RP).  The RP have a couple of simplifications that the team doesn’t believe are important, but should be mentioned for completeness:

  1. The precipitation from the individual satellites is computed with the GPROF algorithm using a different source of temperature and humidity ancillary data.  In the aggregate, the results are very similar.
  2. The entire set of input data is used in RP, whereas in IP it is possible that some of the input will have been delayed and there are not available to create the IP products.  The latency for computing the Early, in particular, is set to wait long enough that we usually capture 85-90% of the eventual input.

A final point is that the complement of satellites and (sometimes) their overpass times change over time.  To the extent that different sensors “see” different interpretations of the precipitation, and the IMERG intercalibration is not entirely able to overcome this, the team expects at least slight variations over time in quality and performance.  This issue is less critical if you are looking at mean behavior, but more important if you are trying to estimate extremes.
 

Are there multiple GEO-IR or passive microwave (PMW) samples that contribute to the values within each IMERG grid-box, and if so, are these source data available from the PPS?

The most frequent number of samples of PMW data for an IMERG grid box in any given 30-minute period is overwhelmingly zero, with one in most of the rest. In a very few cases there are two or more. However, the histogram of single values of precipitation rate differs substantially from histograms of two, three, or four averaged together. Once the team realized this several IMERG versions ago, they instituted a down-select scheme to provide the single "best" PMW estimate in each grid box at each time. The GEO-IR brightness temperatures used are from the Climate Prediction Center (CPC) Merged 4-km Global IR data product, which gives the "best" GEO-IR value each half hour in each ~4x4 km (at the Equator) grid box.  The down-select of GEO-IR to a consistent number of samples (here, one) in a half hour is done at the CPC, which ensures that the GEO-IR values are all drawn from nearly the most consistent record achievable.  Inter-satellite differences and differences in retrievals due to surface climate regime are still realities for both PMW and GEO-IR.  

To summarize, there are multiple values for both PMW (occasionally) and GEO-IR (with a frequency depending on the satellite being used at any given time and place), but:

  1. Organized records of the not-selected passive microwave samples do not exist - although a user could construct this from the PPS archive of all the Level 2 products.  
  2. Accessing “all” the GEO-IR is a daunting task - and these data would be brightness temperatures, not precipitation estimates.

As such, IMERG is best described as "half-hourly snapshots".  The IMERG team suggests that the most sensible way to use these data is to treat them as the average for the half-hour period, since there is no additional information about the sub-half-hourly sequence of events, particularly in the case where the IMERG value is based on "morphed" passive microwave values from other times.
 

Hide Date