
Landslide Viewer is the portal to visualize the data from the Cooperative Open Online Landslide Repository (COOLR). Data visualized includes citizen science landslide reports, Global Landslide Catalog data, and other landslide catalog data. You can customize the map view by selecting different layers with landslide and environmental information. You can also download all landslide data or get the ArcGIS REST API for in-depth analysis from the portal.
Landslide Viewer Quick Start
Contents
Accessing the application
Landslide Viewer can be accessed by an internet browser on either your computer or mobile device. The URL for reaching Landslide Viewer is
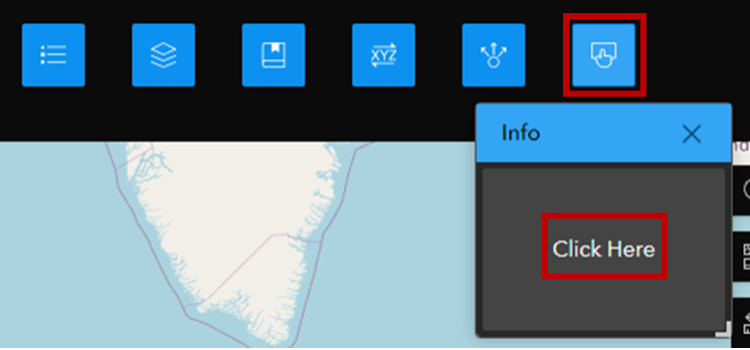
On your first time loading the page, you will be presented with the Terms and Conditions of using Landslide Viewer. Checking the box “I agree to the above terms and conditions” will grant you access to the application. This will only pop-up on your first visit to the webpage. If you’d like to review the Terms and Conditions again, click on the “Info” button on the right, and click “Click Here”.
Using Landslide Viewer on the web
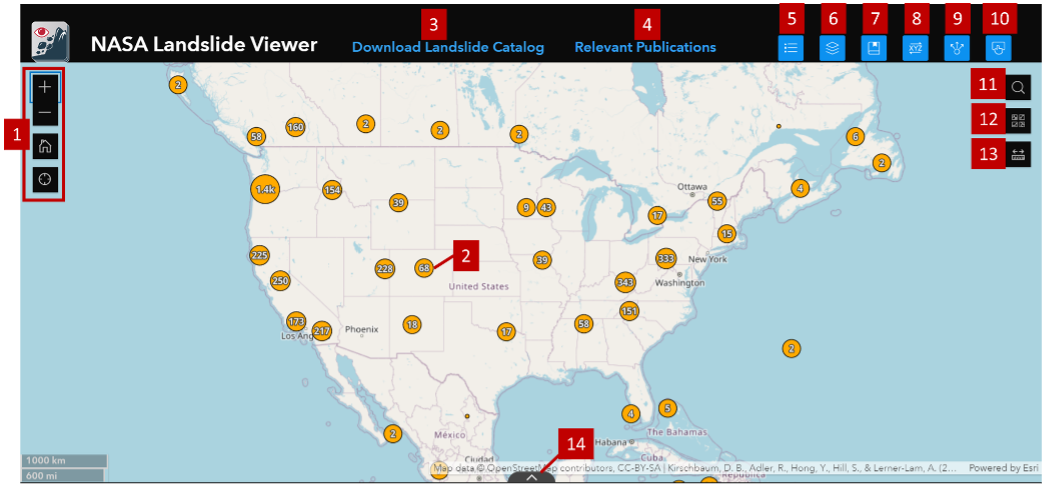
Main Screen
- Map navigation: Zoom and search for locations.
- Orange points or red polygons: Clustered landslide events added to the Cooperative Open Online Landslide Repository (COOLR). Clicking will open details about that cluster of events or if zoomed in, the specific event.
- Download: Opens a new page with the link to download the landslide catalog.
- Relevant Publications: Opens a new page with the NASA Landslide Team’s relevant publications.
- Legend: Opens a legend displaying the symbology of the currently selected layers on the map.
- Layer List: Select/deselect what to display on the map, like the inventory points and polygons, models for flood and landslide risk, etc. Click the “eyeball” button (
 ) to turn on and off layers. Layers are grouped, so click the arrow next to the layer group name to see more. Entire layer groups can be turned on and off. Click the ellipses next to the grouped layer to zoom to and increase and decrease opacity. Click the info icon next to a single layer to get the REST service URL.
 - Bookmark: Your saved/bookmarked locations and the option to add/delete bookmarks.
- Coordinate Conversion: Enter coordinates or an address for the map to take you to a desired location. Or use the “Add Point” button within this tool to click anywhere in the map to retrieve coordinates or an address.
- Share: To retrieve a link or short link for this application. Or to share via embedding, email, or social media.
- Information: Information about Landslide Viewer, including the Terms and Conditions from the original pop-up on the application.
- Search: Type in a location or address and the map will zoom to that area.
- Basemap Gallery: Different options for the base or reference map, like satellite imagery, OpenStreetMap roads, terrain, etc.
- Measurement: Measure area, measure distance, and find geographic coordinates.
- Attribute Table: Opens an attribute table of the layer that is currently displayed on the map.
Using Landslide Viewer on your mobile device
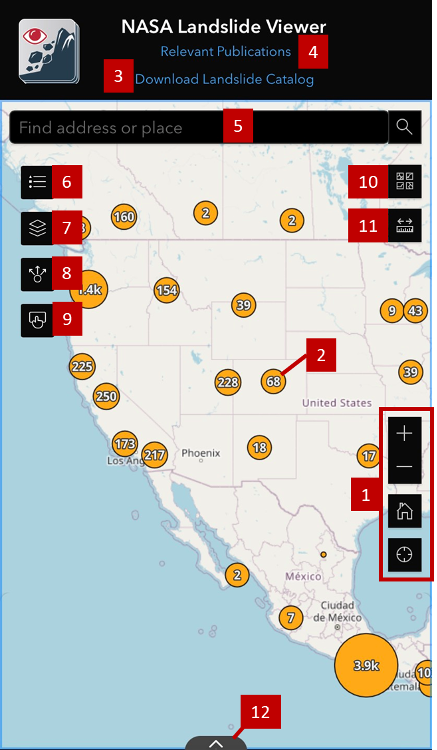
Main Screen
-
- Map navigation: Zoom and search for locations.
- Orange points or polygons: Clustered landslide events added to the Cooperative Open Online Landslide Repository (COOLR). Clicking will open details about that cluster of events or if zoomed in, the specific event.
- Download: Opens a menu with the link to download the landslide catalog.
- Relevant Publications: Opens a new page with the NASA Landslide Team’s relevant publications.
- Search: Type in a location or address and the map will zoom to that area.
- Legend: Opens a legend displaying the symbology of the currently selected layers on the map.
- Layer List: Select/deselect what to display on the map, like the inventory points and polygons, models for flood and landslide risk, etc. Click the “eyeball” () button to turn on and off layers. Layers are grouped, so click the arrow next to the layer group name to see more. Entire layer groups can be turned on and off. Click the ellipses next to the grouped layer to zoom to and increase and decrease opacity. Click the info icon next to a single layer to get the REST service URL.
- Share: To retrieve a link or short link for this application. Or to share via embedding, email, or social media.
- Information: Information about Landslide Viewer, including the Terms and Conditions from the original pop-up on the application.
- Basemap Gallery: Different options for the map, like satellite imagery, OpenStreetMap roads, terrain, etc.
- Measurement: Measure area, measure distance, and find geographic coordinates.
- Attribute Table: Opens an attribute table of the layer that is currently displayed on the map.
COOLR data analysis options in Layer List
The data from the Cooperative Open Online Landslide Repository (COOLR) can be organized and displayed in several ways on the map. Below are the available options in Layer List
 .
.
| Data Type | Description |
|---|---|
| Landslide Points/Polygons | All points or polygons representing landslide events are marked on the map. Polygons are displayed as points when you are zoomed out, and will show up as polygons as you zoom closer. |
| Fatalities | All points are sized by how many fatalities occurred because of the event. |
| Trigger | All points are colored by the landslide trigger, the immediate cause of the landslide. |
| Catolog | All points are colored by the landslide catalog they came from. |
Related Pages
Connect with Us
Twitter: @LandslideReport
Facebook: LandslideReporter
SciStarter: Join us on our project page
Connect with the Community
Google Groups: Landslide Reporter Community
Contact Us
For any questions related to this system, please contact landslide_support@nccs.nasa.gov.