Learn more about other projects by our landslide team, including how COOLR is being used for model validation. More information about the Cooperative Open Online Landslide Repository (COOLR) and citizen science can be found on the About page.
These projects are also demonstrated on Landslide Viewer.Contents
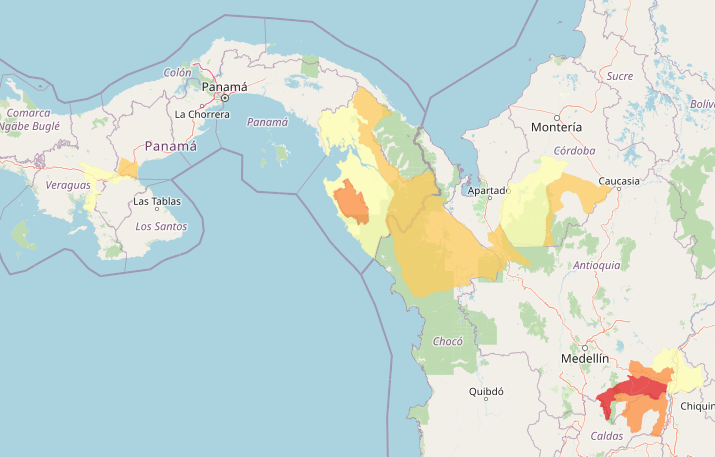
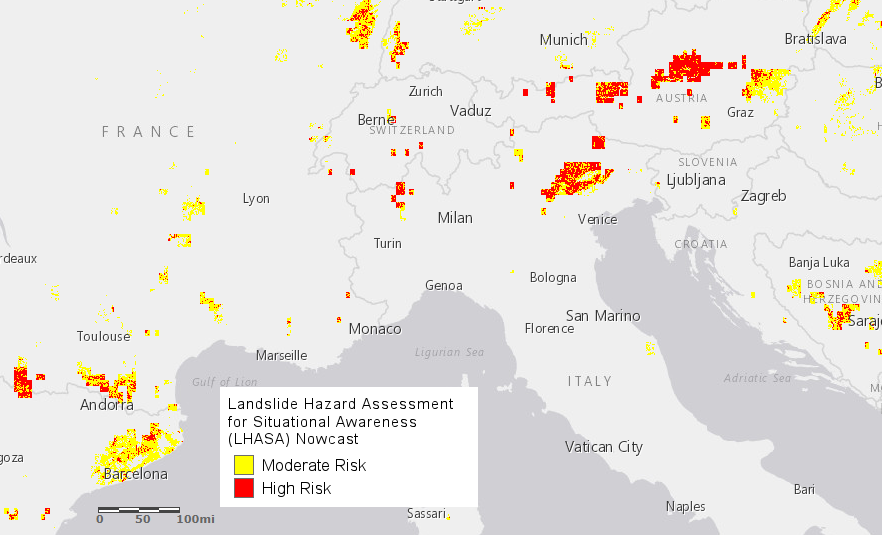
Landslide Hazard Assessment for Situational Awareness (LHASA) Model
LHASA 2.0
The global Landslide Hazard Assessment for Situational Awareness version 2 (LHASA 2.0) maps areas of potential landslide hazard in real time. It improves upon LHASA 1.1 by incorporating landslide inventories from around the world within a machine learning framework that estimate the relative probability of landslide occurrence. LHASA 2.0 relies on the following variables: snow mass, soil moisture, slope, distance to faults, lithologic strength, antecedent rainfall, and current daily rainfall. Current and antecedent rainfall are derived from the Global Precipitation Measurement (GPM) Integrated Multi-SatellitE Retrievals for GPM (IMERG), while forecasted precipitation comes from GEOS-FP, a global weather prediction system. In addition, LHASA 2.0 estimates the potential exposure of human population and roads to landslide hazard and maps the basins likely to experience post-fire debris flows. The model was validated with reference to the Global Landslide Catalog (GLC) and several other inventories of rainfall-triggered landslide events. LHASA 2.0 is twice as likely to predict the occurrence of historical landslides as LHASA 1.1, while having the same false positive rate. LHASA 2.0 is open-source and is produced at a 1-km resolution.
LHASA 2.0 Exposure Analysis:
Landslide reporting is biased towards developed countries, which limits our understanding of landslides in developing countries. Therefore, we combined LHASA 2.0 with open-source datasets on population, roads, and infrastructure to estimate exposure to landslide hazards around the world. The exposure model fills major gaps in inventory-based estimates in developing countries with lower reporting capacity, while comparing favorably with existing datasets of rainfall-triggered landslide fatalities.
LHASA 2.0 Post-Fire Debris Flow Analysis:
Following wildfires in rugged and/or mountainous terrain, high intensity rainfall frequently leads to the cascading hazard of post fire debris flows (PFDFs). These flows can destroy infrastructure and take human lives. LHASA 2.0 also leverages global data to routinely assess the global potential for PFDF over steep, burned areas. This component remains in development with further updates to come.
Download the Version 2 software: https://github.com/nasa/lhasa
Current output: https://landslides.nasa.gov/viewer
Exposure Code: available upon request
PFDF Code: https://github.com/nasa/LHASA/tree/master/pfdf
Publications and Media
- Emberson, R., D. Kirschbaum, and T. Stanley. 2020. "New global characterisation of landslide exposure." Natural Hazards and Earth System Sciences, 20 (12): 3413-3424. doi:10.5194/nhess-20-3413-2020
- Khan, S., D. Kirschbaum, and T. Stanley. 2021. "Investigating the potential of a global precipitation forecast to inform landslide prediction." Weather and Climate Extremes, 33: 100364 10.1016/j.wace.2021.100364
- Stanley, T., Kirschbaum, D., Benz, G., Emberson, R., Amatya, P., Medwedeff, W., and Clark, Marin. (2021). Data-Driven Landslide Nowcasting at the Global Scale. Frontiers in Earth Science. 9. doi: 10.3389/feart.2021.640043.
LHASA 1.1
The global Landslide Hazard Assessment for Situational Awareness version 1.1 (LHASA 1.1) maps when and where landslides may occur. LHASA 1.1 incorporates IMERG precipitation data and landslide susceptibility data into a single heuristic decision tree. The global landslide susceptibility map considers slope, geology, road networks, fault zones, and forest loss. For model validation, Global Landslide Catalog (GLC) landslide inventories were used. Although LHASA 2.0 surpasses LHASA 1.1 in accuracy and features, LHASA 1.1 may be preferred by some users for its simplicity. LHASA 1.1 is open-source and is produced at a 1-km resolution.
Download the Version 1 software: https://github.com/nasa/lhasa
Current output: https://gpm.nasa.gov/precip-apps
Susceptibility Map: https://gpm.nasa.gov/sites/default/files/downloads/global-landslide-susceptibility-map-2-27-23.tif
Data archive for Version 1: https://disc.gsfc.nasa.gov/datasets/Global_Landslide_Nowcast_1.1/summary
Publications and media:
- Emberson, R., D. Kirschbaum, and T. Stanley. 2020. "New global characterisation of landslide exposure." Natural Hazards and Earth System Sciences, 20 (12): 3413-3424. doi: 10.5194/nhess-20-3413-2020.
- Kirschbaum, D. and Stanley, T. (2018). Satellite-Based Assessment of Rainfall-Triggered Landslide Hazard for Situational Awareness. Earth's Future. doi:10.1002/2017EF000715.
- "New NASA Model Finds Landslide Threats in Near Real-Time During Heavy Rains", NASA, Greenbelt, MD (March 22, 2018)
- Stanley, T., and D. B. Kirschbaum. 2017. "A heuristic approach to global landslide susceptibility mapping." Natural Hazards, 1-20. doi: 10.1007/s11069-017-2757-y.
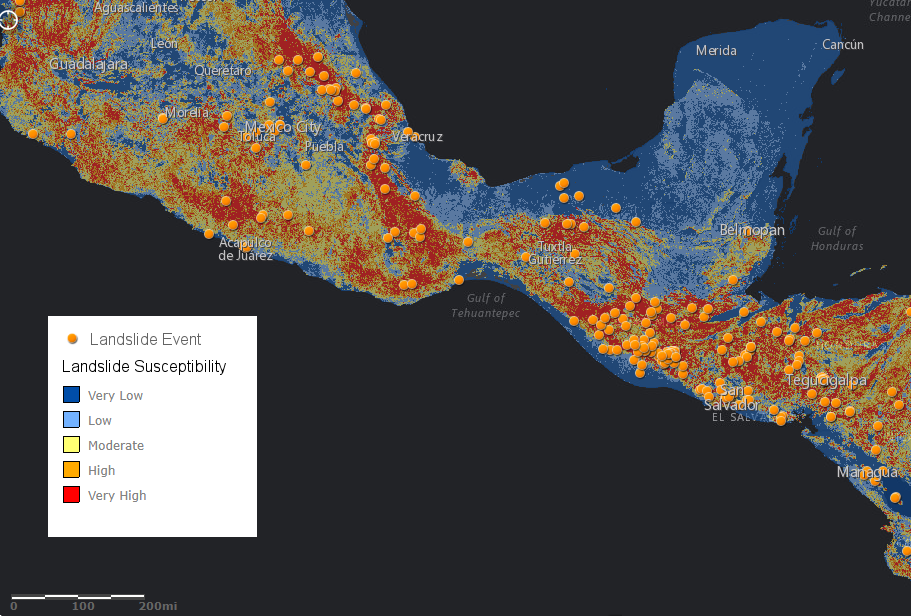
Landslide Susceptibility Map
The landslide susceptibility map was developed to show where the terrain is most susceptible to landslides. The susceptibility model considers whether roads have been built, trees have been cut down or burned, a major tectonic fault is nearby, the local bedrock is weak, and/or the hillsides are steep. This map was combined with Global Precipitation Measurement (GPM) data to develop the LHASA 1.1 model.
Publications and Media
- Emberson, R., D. Kirschbaum, and T. Stanley. 2020. "New global characterisation of landslide exposure." Natural Hazards and Earth System Sciences, 20 (12): 3413-3424. doi:10.5194/nhess-20-3413-2020
- Stanley, T., & Kirschbaum, D. B. (2017). A heuristic approach to global landslide susceptibility mapping. Natural Hazards, 87(1), 145-164. doi:10.1007/s11069-017-2757-y
- Kirschbaum, D., Stanley, T., & Yatheendradas, S. (2016). Modeling landslide susceptibility over large regions with fuzzy overlay. Landslides, 13(3), 485-496. doi:10.1007/s10346-015-0577-2
- "A Global View of Landslide Susceptibility", NASA Earth Observatory, Greenbelt, MD (March 30, 2017)
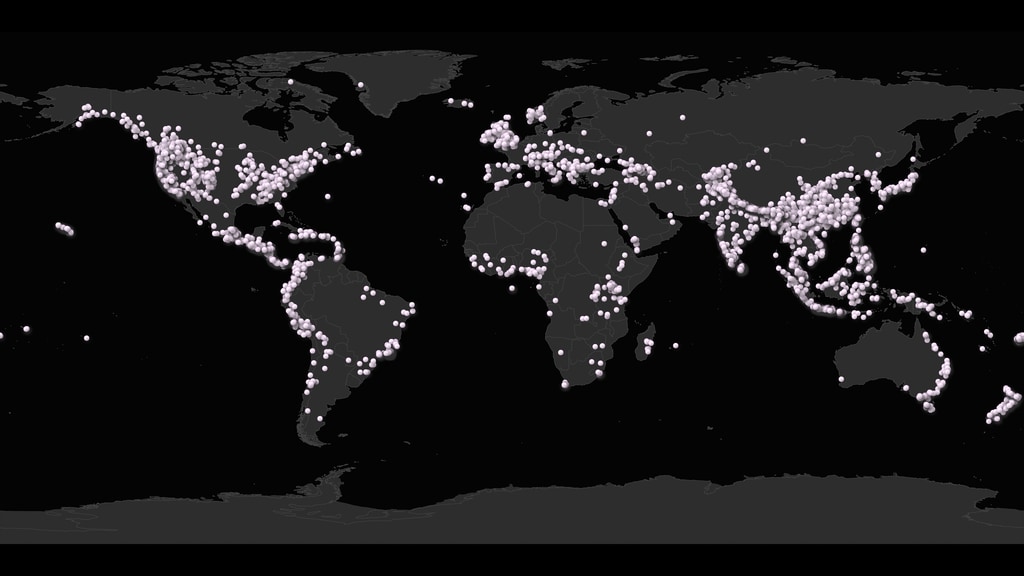
Global Landslide Catalog (GLC)
The NASA Global Landslide Catalog (GLC) is the largest openly available global inventory of rainfall-triggered mass movements known to date. The inventory was created at NASA Goddard Space Flight Center (GSFC) and currently contains more than 11,500 reports on landslides, debris flows, rock avalanches, etc. around the world. Reports of landslides are found primarily from online media, including news articles as well as other databases. The GLC has been compiled by scientists, interns and other colleagues at NASA GSFC. The GLC has been cited more than 75 times in peer-reviewed articles.
The GLC is a part of the Cooperative Open Online Landslide Repository (COOLR), and can be downloaded on Landslide Viewer. When COOLR is downloaded, GLC data can be found in the “nasa_coolr_reports” layer and then filtered by the label "GLC" in the field "event_import_source". For referencing the GLC in research, please see the Downloading the Data page. The GLC was used for model validation in both LHASA 1.1 and LHASA 2.0.
Download COOLR data: Landslide Viewer
Publications and Media
- Kirschbaum, D.B., Stanley, T., & Zhou, Y. (2015), Spatial and temporal analysis of a global landslide catalog. Geomorphology, 249, 4-15. doi:10.1016/j.geomorph.2015.03.016.
- Kirschbaum, D.B., Adler, R., Hong, Y., Hill, S., & Lerner-Lam, A. (2010), A global landslide catalog for hazard applications: method, results, and limitations. Natural Hazards, 52, 561-575. doi:10.1007/s11069-009-9401-4.
- "Global Landslide Catalog Aids View From Space", NASA, Greenbelt, MD (April 16, 2015)
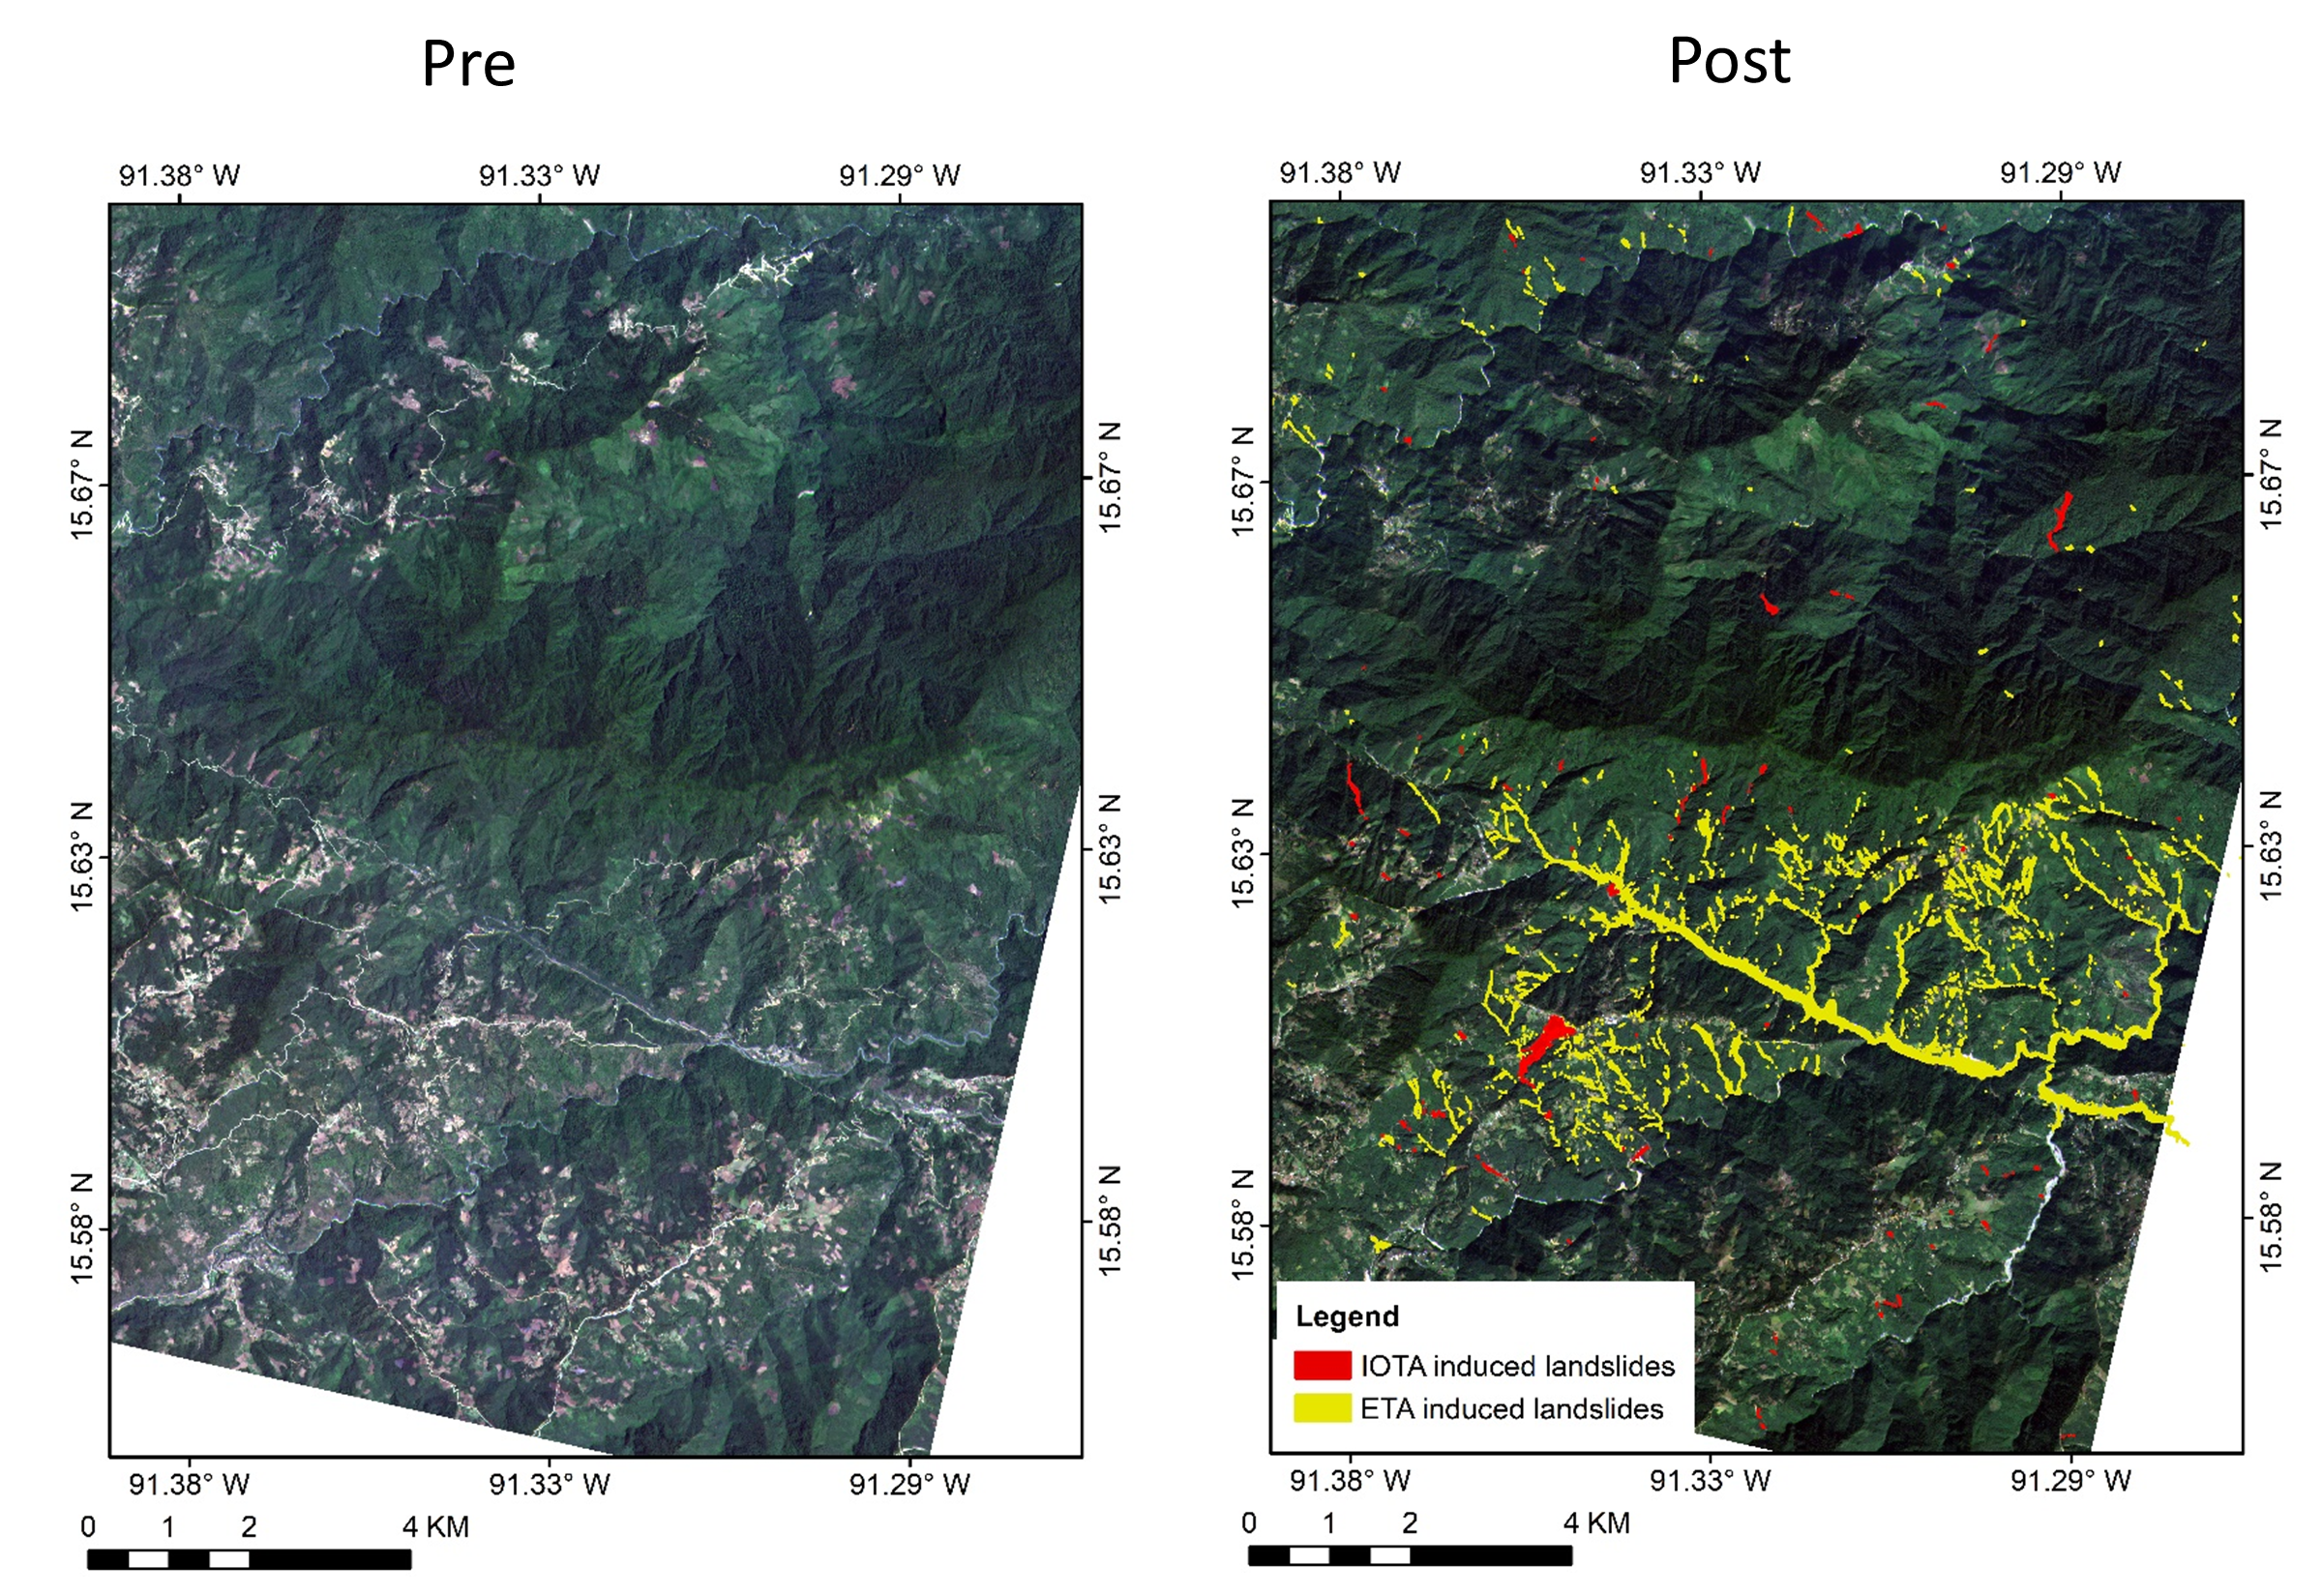
Semi-Automatic Landslide Detection (SALaD)
To simplify the ability to map landslides across a region, we developed an open-source Semi-Automatic Landslide Detection (SALaD) system. SALaD uses Object-based image analysis and machine learning to detect landslides from optical imagery. This system is especially useful after a disaster occurs where quick mapping is needed to help with situational awareness on the ground.
Download the code: https://github.com/nasa/SALaD
Publications and Media
- Amatya, P., Kirschbaum, D., Stanley, T., and Tanyas, H. (2021). Landslide mapping using object-based image analysis and open source tools. Engineering Geology. 282. doi: 10.1016/j.enggeo.2021.106000.
- Amatya, P., Kirschbaum, D., and Stanley, T. (2021). Rainfall-induced landslide inventories for Lower Mekong based on Planet imagery and a semi-automatic mapping method. Geoscience Data Journal. doi: 10.1002/gdj3.145.
Related Pages
Resources Publications Media Resources Landslide Team Projects Related SitesConnect with Us
Twitter: @LandslideReport
Facebook: LandslideReporter
SciStarter: Join us on our project page
Connect with the Community
Google Groups: Landslide Reporter Community
Contact Us
For any questions related to this system, please contact landslide_support@nccs.nasa.gov.