Browse Data Resources
Browse Data Resources
Primary Topic:
Subtopics:
Type:
Keywords:
Summary:
Welcome to the Tour of the Electromagnetic Spectrum. This unique NASA resource on the web, in print, and with companion videos introduces electromagnetic waves, their behaviors, and how scientists visualize these data.
Primary Topic:
Subtopics:
Type:
Keywords:
Summary:
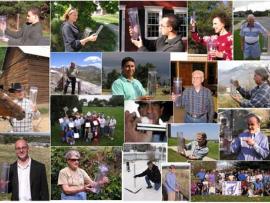
CoCoRaHS is a Citizen Science organization that helps participants collect and share precipitation data. They also assist teachers in learning how to install and use rain gauges with their students. Learn how to collect and submit measurements to CoCoRaHS
Primary Topic:
Subtopics:
Type:
Standards:
Keywords:
Summary:
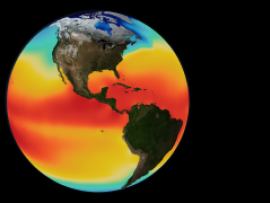
The animations in this group show the long-term average sea surface temperature, the long term average sea surface salinity, and the the long term average sea surface density.
Primary Topic:
Subtopics:
Type:
Keywords:
Summary:
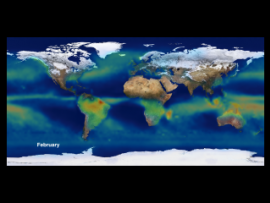
This animation of global precipitation from the Global Precipitation Climatology Project (GPCP) cycles through climatology data for each month of the year and then repeats the cycle twice.
Primary Topic:
Subtopics:
Type:
Keywords:
Summary:
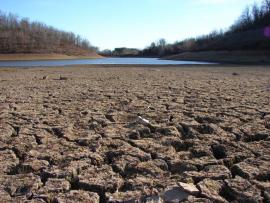
When drought occurs, water supplies for agriculture, industry, and personal use decrease, and people need to find ways to cope with the shortage or leave the area. This series of lesson plans teaches students about the science of droughts.
Primary Topic:
Subtopics:
Type:
Standards:
Keywords:
Summary:
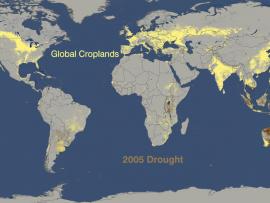
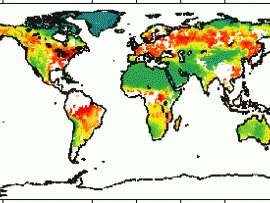
Using data from various satellites, these images show maps of the location of world droughts compared to where crops are grown.
Primary Topic:
Subtopics:
Type:
Standards:
Keywords:
Summary:
For a selected location, the student will investigate possible relationships between the vegetation index, the precipitation, and the surface temperature data over several years' time. Using that information, the student will predict the climate type...
Primary Topic:
Subtopics:
Type:
Standards:
Keywords:
Summary:
In this lesson, weather data from ground-based and satellite observations are analyzed for a real world application -- to plan a high mountain retreat in Tibet.


