Search
Primary tabs
Search
Your search for "climate" gave back 164 results.
Primary Topic:
Subtopics:
Type:
Keywords:
Summary:
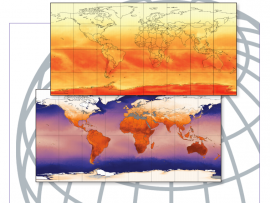
The activities in this guide will help students understand variations in environmental parameters by examining connections among different phenomena measured on local, regional and global scales.
Primary Topic:
Subtopics:
Type:
Keywords:
Summary:
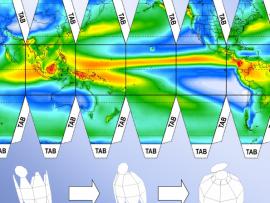
An activity in which students will cut and fold paper to create a 3D sphere which displays precipitation climatology.
Primary Topic:
Subtopics:
Type:
Keywords:
Summary:
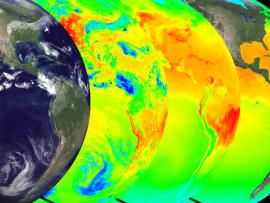
Explore the solar heating of the ocean in part one of a series on the water cycle. The animations show multiple views of the solar heating of the oceans, a picture of this first stage of water's cyclical journey from sea to air to land, and back again.
Primary Topic:
Subtopics:
Type:
Keywords:
Summary:
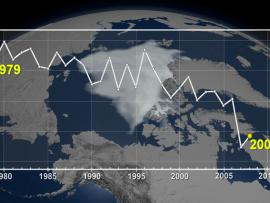
The cryosphere consists of those parts of the Earth's surface where water is found in solid form, including areas of snow, sea ice, glaciers, permafrost, ice sheets, and icebergs. This animation shows fluctuations in the cryosphere.
Primary Topic:
Subtopics:
Type:
Keywords:
Summary:
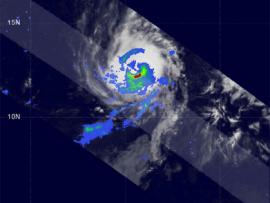
This website offer teachers and their students some background on how NASA is supporting the study of Earth's weather systems. There is a good image of TRMM data being used to understand tropical storms, and links to other websites with additional info.
Primary Topic:
Subtopics:
Type:
Keywords:
Summary:
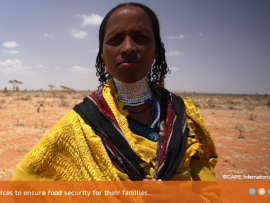
This website describes a study that is being conducted to understand the complexities of rainfall patterns and their effects on food security and human mobility.
Primary Topic:
Subtopics:
Type:
Keywords:
Summary:
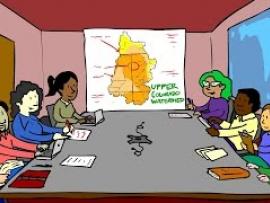
This short animation from the Community Collaborative Rain Hail and Snow Network shows how decision makers use a variety of data and in-person reports to assess the drought conditions across the United States.
Primary Topic:
Subtopics:
Type:
Keywords:
Summary:
GPM Application Science Lead, Dr. Dalia Kirschbaum, explains how landslides and floods occur, and how satellite imagery is used in understanding these disasters.
Primary Topic:
Subtopics:
Type:
Summary:
In this IQuest, you will explore resources to help you learn about the Sentinel-6 Michael Freilich satellite, the science behind sea level rise, and the STEM related careers of several of the scientists and engineers involved with this effort.
Primary Topic:
Subtopics:
Type:
Keywords:
Summary:
CoCoRaHS is a Citizen Science organization that helps participants collect and share precipitation data. They also assist teachers in learning how to install and use rain gauges with their students. Learn how to collect and submit measurements to CoCoRaHS


