GPM

GPM content

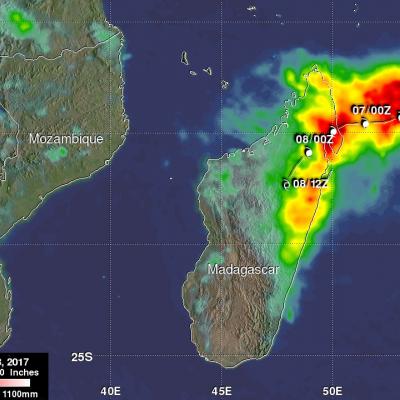
Tropical Cyclone Enawo's Rainfall Totals Updated With IMERG

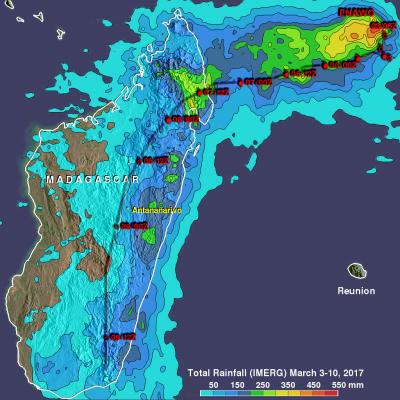
Tropical cyclone Enawo is now responsible for the deaths of at least five people in Madagascar. Many thousands of people were also displaced due to flooding and destroyed homes. The tropical cyclone dropped heavy rainfall as it soaked the island from north to south. This rainfall analysis was updated to include recent precipitation estimates from NASA's Integrated Multi-satelliE Retrievals for GPM (IMERG) rainfall data. It shows rainfall estimates from IMERG data collected during the period from March 3-10, 2017. As expected, the eastern side of Madagascar had the highest rainfall total

IMERG V04 Early and Late Online

The algorithm for the Integrated Multi-satellitE Retrievals for GPM (IMERG) Early and Late Runs has now been upgraded to Version 04. The transition to V04 began at 15 UTC on March 13 and both the early and the late products were back to their target latency by 01:00 UTC, March 14. The transition took longer than planned but the core IMERG version 04 products are now running automatically as the original V03. The product version is V04A and you will see this in the name of the IMERG HDF5 products. For IMERG late the V03 products have remained before February 05, 2017. For IMERG early V03

Deadly Tropical Cyclone Enawo Drenches Madagascar

Tropical cyclone Enawo hit Madagascar on Tuesday with powerful winds and drenching rain. At least three people have been reported killed by the tropical cyclone. Floods and landslides are likely as Enawo moves southward down the center of Madagascar. Tropical cyclones rotate in a clockwise direction in the southern hemisphere so the eastern side of Madagascar will have a strong onshore flow. The extreme amount of moisture flowing onto Madagascar from the Indian Ocean is expected to produce flooding and landslides. NASA's Integrated Multi-satelliE Retrievals for GPM (IMERG) data are produced

NASA Examines Deadly Spring-Like Weather With GPM Satellite

Rainfall from spring-like downpours in the U.S. from February 25 to March 1 were analyzed at NASA using data from the Global Precipitation Measurement mission or GPM satellite. This GPM rainfall image combined with infrared cloud data from NOAA's GOES-West satellite shows the line of storms that stretched from Pennsylvania to Alabama on March 1, 2017. Red areas indicate rainfall up to 50 mm per hour. Record breaking warm temperatures this winter have caused plants to bloom early in the eastern United States. Unfortunately this has also resulted in the formation of spring-like severe

Powerful Tropical Cyclone Enawo Threatens Madagascar

Tropical cyclone Enawo has continued to intensify while moving toward Madagascar. Enawo had winds of about 90 kts (103.5 mph) when the GPM core observatory satellite flew over on March 6, 2017 at 0306 UTC (0606 AM local time). These powerful winds make Enawo the equivalent of a category two hurricane on the Saffir-Simpson Hurricane wind scale. GPM revealed that the tropical cyclone had heavy rainfall in distinct feeder bands on the western side and in the northeastern side of the eyewall. Precipitation was measured by GPM's DPR falling at a rate of over 220 mm (8.7 inches) per hour in intense

Upcoming IMERG version update to V04A

The algorithm for the Integrated Multi-satellitE Retrievals for GPM (IMERG) Early and Late Runs has now been upgraded to Version 04. The transition to V04 is planned to happen on Monday, March 13 by 15 UTC at PPS and the new data should start flowing down to the GES DISC as well. Access and data fields continue to be the same as for Version 03, except the version number is 04A. Initially, the data records begin on 5 February 2017 for the Late Run, and about 5 hours before the time when PPS begins processing after the switchover for the Early Run. Version 04 supersedes all prior IMERG versions
Another Pineapple Express Brings More Rain, Flooding to California
The West Coast is once again feeling the effects of the "Pineapple Express". Back in early January one of these "atmospheric river" events, which taps into tropical moisture from as far away as the Hawaiian Islands, brought heavy rains from Washington and Oregon all the way down to southern California. This second time around, many of those same areas were hit again. The current rains are a result of 3 separate surges of moisture impacting the the West Coast. The first such surge in this current event began impacting the Pacific coastal regions of Washington, Oregon, and northern California on...

GPM Examines Deadly Tropical Cyclone Dineo

Dineo has now weakened to a tropical depression but the tropical cyclone had winds of over 70 kts (80.5 mph) when it hit Mozambique. Four people have been reported killed by Dineo. The GPM core observatory satellite flew over Mozambique on February 16, 2016 at 0916 UTC after Dineo's maximum sustained winds had fallen to about 60 kts (69 mph). Data collected by GPM's Microwave Imager (GMI) and Dual-Frequency Precipitation Radar (DPR) instruments showed that the tropical cyclone was still dropping light to moderate rainfall over a large area of southern Mozambique. This GPM view revealed that

Intensifying Tropical Cyclone Dineo Seen By GPM

Tropical cyclone Dineo was intensifying in the middle of the Mozambique Channel when the GPM core observatory satellite flew over on February 14, 2017 at 0926 UTC. Dineo had winds of about 55 kts (~ 63.3 mph) at the time of this GPM pass. Very heavy precipitation was found in feeder bands on Dineo's northeastern side. The most intense rainfall was measured by GPM's Dual-Frequency Precipitation Radar (DPR) falling at a rate of over 132 mm (5.2 inches) per hour in the intense storms in the northeastern quadrant of the tropical cyclone. GPM's radar (DPR Ku Band) sliced through the center of

GPM Satellite Reveals Intensity Of Powerful Storms In The Timor Sea

The GPM satellite flew over a stormy area of the Timor Sea northwest of Australia on February 7, 2017 at 1926Z. GPM found that this stormy area contained some extremely powerful convective storms. GPM's Dual-Frequency Precipitation Radar (DPR) found that the most intense storms were dropping rain at a rate of over 268 mm (10.6 inches) per hour. Data received by GPM's Radar (DPR Ku Band) also revealed the 3-D anatomy of precipitation hidden inside these unusually powerful storms. GPM's radar found that these storm tops were pushing to altitudes greater than 19 km (11.8 miles). GPM radar data