Typhoons

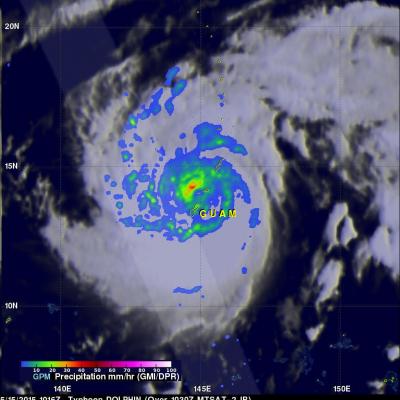
Typhoon Dolphin Weakening after Drenching Guam

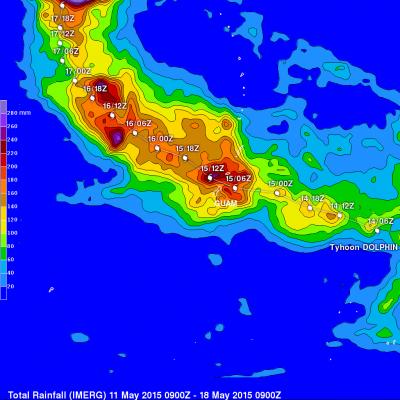
Typhoon Dolphin battered and drenched the islands of Guam and Rota as it passed over the channel between them last Saturday. Luckily for Guam, Dolphin's most powerful winds occurred after passing to the northwest of Guam. By May 16, 2015 Dolphin had winds estimated at 140 kts (161 mph) making it a category five super typhoon on the Saffir-Simpson hurricane wind scale. The GPM core observatory satellite flew above the weakening typhoon early this morning when winds had dropped to less than 100 kts (115 mph). GPM's Microwave Imager (GMI) found that Dolphin was dropping rain over the open waters

Typhoon Dolphin Brushes Guam

Typhoon Dolphin passed through the Northern Marianas today just to the north of Guam with sustained winds estimated at 95 knots (~109 mph) by the Joint Typhoon Warning Center. The center passed through the Rota Channel less than about 25 iles from the northern tip of Guam, close enough for the southern half of the eye wall to rake the northern part of the island with powerful winds. A wind gust of 106 mph was reported at Andersen Air Force Base located on the northeast corner of Guam. NASA's GPM Core observatory satellite captured this image of Dolphin just as the center was exiting the Rota

GPM Views Typhoon Dolphin Headed For Guam

Typhoon Dolphin formed south of Pohnpei in the western Pacific Ocean on May 7, 2015. Dolphin's power has oscillated from a weak tropical depression to typhoon intensity over the past five days. Dolphin is now an intensifying typhoon headed westward. The GPM core observatory satellite flew over Dolphin on May 12, 2015 at 2301 UTC. At that time Dolphin's wind speeds were estimated at about 65 kts (75 mph). Rainfall collected by GPM's Microwave Imager (GMI) showed that rain was falling at a rate of over 47 mm (1.9 inches) per hour in a feeder band to the southeast of Dolphin's eye. Ku Band data

Typhoon Noul Beginning to Strengthen in the West Pacific

Since its formation as a tropical depression 3 days ago, Typhoon Noul has taken on a general westward motion while steadily working its way across the central-west Pacific. During this time, the system passed over Yap where it brought heavy rain and strong gusty winds. Thus far, Noul has been only slowly strengthening, becoming a minimal typhoon just one day ago. That appears likely to change, however, as the system now seems poised to intensify as it passes well north of Palau in the genearal direction of the Philippines. NASA's GPM Core observatory satellite captured this image of Noul as it

GPM Saw Deadly Maysak Approaching The Philippines

Typhoon Maysak caused the reported deaths five people in the Federated States of Micronesia and as a tropical storm killed seven others when it hit the the north-eastern Philippines. The GPM core observatory satellite passed above dissipating typhoon Maysak when it was approaching the Philippines on April 3, 2015 at 2326 UTC. An analysis of rainfall from GPM's Microwave Imager (GMI) showed that Maysak was dropping rain at a rate of over 69 mm (2.7 inches) per hour. Vertical wind shear was causing typhoon Maysak to weaken as it moved toward the Philippines but data from GPM's Dual-Frequency

Typhoon Maysak Starts Weakening

The GPM core observatory satellite passed above typhoon Maysak in the western Pacific Ocean on April 2, 2015 at 2343 UTC. GPM's Microwave Imager (GMI) found heavy rain in Maysak's northwestern side but the typhoon had weakened from it's peak intensity of over 130 kts (150 mph) to about 115 kts (132 kts) at the time of this satellite view. GPM's Radar (Ku Band) was used in this 3-D view to show vertical structure within typhoon Maysak. This view, looking toward the southwestern side of Maysak's eye, shows that the eye wall was eroding on that side. Vertical wind shear has contributed to typhoon
GPM's Worldwide Tour of Global Precipitation
Rain, snow, hail, ice, and every mix in between make up the precipitation that touches everyone on our planet. But precipitation doesn't fall equally in all places around the world, as seen in NASA's new animation that captures every shower, snowstorm and tropical cyclone over a six-day period in August 2014. The time lapse was created from data captured by the Global Precipitation Measurement (GPM) satellite mission, now just over a year old, which scientists are using to better understand freshwater resources, natural disasters, crop health and more. Image Credit: NASA's Goddard Space Flight...

TRMM And GPM See Typhoon Maysak

The TRMM satellite has been collecting valuable scientific data since November 1997. Early today the satellite collected rainfall data from recently formed typhoon Maysak as it flew directly above on March 30, 2015 at 0414 UTC. This image shows rainfall data collected with this orbit by TRMM's Microwave Imager (TMI) and Precipitation Radar (PR) instruments. With sustained winds of over 85 kts (98 mph) Maysak was a category two typhoon on the Saffir-Simpson hurricane wind scale. A little over eight hours later the GPM core observatory satellite also viewed typhoon Maysak on March 30, 2015 at

Mekkhala Becomes A Typhoon, Drenches The Philippines

On January 16, 2015 tropical storm Mekkhala became the first western Pacific typhoon of the year just before hitting the eastern Philippines. This image shows rainfall derived from data captured by the GPM (core satellite) on January 16, 2015 at 2200 UTC. This was only about four hours after Mekkhala was upgraded to a typhoon. GPM's Microwave Imager (GMI) found rain falling at a rate of over 70.7 mm (about 2.8 inches) per hour in storms southwest of the typhoon's eye. Rainfall over the Philippines, enhanced by typhoon Mekkhala, was analyzed using near real time merged satellite data (3B42)
GPM Scans Typhoon Phanfone
Animation revealing a swath of GPM/GMI precipitation rates over Typhoon Phanfone. The camera then moves down closer to the storm to reveal DPR's volumetric view of Phanphone. A slicing plane dissects the Typhoon from south to north and back again, revealing it's inner precipitation rates. Shades of blue indicate frozen precipitation (in the upper atmosphere). Shades of green to red are liquid precipitation which extend down to the ground. Download in Hi-Res from the Scientific Visualization Studio On October 6, 2014 (0215 UTC) the Global Precipitation Measurement (GPM) mission's Core...