Typhoons

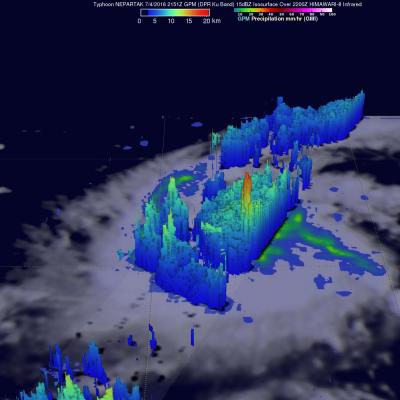
Nepartak Causes Havoc Then Dissipates Over China

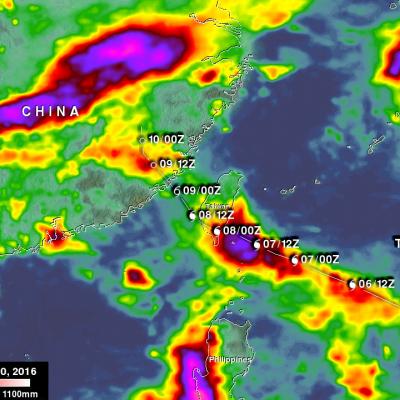
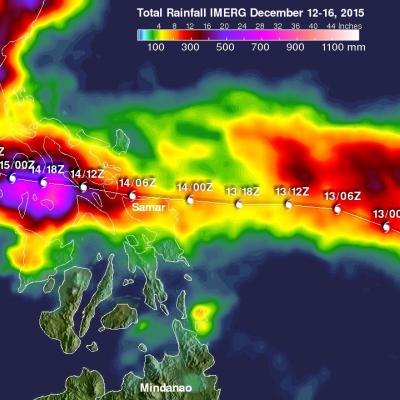
Nepartak was a powerful category four typhoon when it hit Taiwan last week but weakened to a tropical storm as it moved into the Taiwan Strait. Nepartak's winds and heavy rains caused severe problems when it moved ashore over southeastern China. Thousands of homes in China were destroyed by the storm. At least three deaths in Taiwan and six fatalities in China were attributed to Nepartak. Torrential rain caused flash flooding and mudslides in both Taiwan and China. NASA's Integrated Multi-satellitE Retrievals for GPM (IMERG) were again used to estimate the total amount of rain that Nepartak

Rapidly Intensifying Typhoon Examined By GPM

The first typhoon of 2016 called Nepartak developed in the western Pacific Ocean on July 3, 2016 south of Guam. Nepartak has moved to the west-northwest of Guam and has started to rapidly intensify. Warm water, low vertical wind shear and favorable outflow due an upper level trough are providing favorable environmental conditions for the typhoon. The GPM core observatory satellite flew above Nepartak on July 4, 2016 at 2151 UTC when the tropical cyclone was still classified as a tropical storm. GPM's Microwave Imager (GMI) and Dual-Frequency Precipitation Radar (DPR) data showed that Nepartak

GPM 2015: One Year of Storms

Submitted by JacobAdmin on Mon, 01/11/2016
Video Embed

As we enter the new year, take a look back at the snowstorms, tropical storms, typhoons, hurricanes and floods captured and analyzed by the Global Precipitation Measurement (GPM) mission from around the globe during 2015. 

The complete list of storms by date and location are as follows:

1. New England Nor’easter – January 26 – New England, USA
2. Snowstorm – February 17 – Kentucky, Virginia and North Carolina, USA
3. Tornadic Thunderstorms in Midwest – March 25 – Oklahoma and Arkansas, USA

<iframe width="490" height="276" src="https://www.youtube.com/embed/oiGzKmfOvkg?rel=0" frameborder="0" allowfullscreen></iframe>
As we enter the new year, take a look back at the snowstorms, tropical storms, typhoons, hurricanes and floods captured and analyzed by the Global Precipitation Measurement (GPM) mission from around the globe during 2015. The complete list of storms by date and location are as follows: 1. New England Nor’easter – January 26 – New England, USA 2. Snowstorm – February 17 – Kentucky, Virginia and North Carolina, USA 3. Tornadic Thunderstorms in Midwest – March 25 – Oklahoma and Arkansas, USA 4. Typhoon Maysak – March 30 – Yap Islands, Southwest Pacific Ocean 5. Rain Accumulation from Cyclone...

Typhoon Melor Rainfall Measured By IMERG

Since landfall typhoon Melor has destroyed thousands of homes and caused the deaths of at least six people in the Philippines. Melor had hurricane force during most of the time it spent moving through the central Philippines and weakened to tropical storm intensity only after moving into the South China west of the Luzon. Heavy rainfall from the typhoon also caused some flooding along it's path. An analysis of typhoon Melor's rainfall was made using data from NASA's Integrated Multi-satellitE Retrievals for GPM (IMERG). Total rainfall in the area of typhoon Melor from December 12-16, 2015 is

Typhoon IN-FA's Extreme Rainfall Measured By GPM

Typhoon IN-FA's peaked as a category four tropical cyclone on the Saffir-Simpson scale with maximum sustained winds of about 115 kts (132 mph) on November 21, 2015. IN-FA's winds had decreased to about 90 kts (103.5 mph) when the GPM core observatory satellite flew over on November 23, 2015 at 1555 UTC. Measurements by GPM's Dual-Frequency Precipitation Radar (DPR) instrument indicated that IN-FA was dropping rain at an extreme rate of over 266 mm (10.5 inches) per hour in storms just to the northwest of the typhoon's eye. GPM's radar (DPR Ku Band) were used to show the 3-D structure of

GPM Sees Better Organized Typhoon IN-FA

The GPM core observatory satellite had another excellent view of typhoon IN-FA on November 19, 2015 at 0305 UTC. This GPM pass revealed the location of typhoon IN-FA's eye beneath dense overcast. Rainfall derived from data collected by GPM's Microwave Imager (GMI) and Dual-Frequency Precipitation Radar (DPR) instruments show that feeder bands around IN-FA were getting better organized. The most intense precipitation was measured in IN-FA's eye wall by DPR where it was falling at a rate of almost 55 mm (2.16 inches) per hour. Most rainfall in feeder bands was shown by GPM to be only light to
GPM Monitors Western Pacific Typhoon IN-FA JacobAdmin Thu, 11/19/2015
On November 18, 2015 at 1533 the GPM core observatory satellite flew directly over a recently formed typhoon called IN-FA that was located near the Equator well to the southeast of Guam. Favorable environmental conditions such as low vertical wind shear and warm sea surface temperatures helped typhoon IN-FA intensify quickly from a tropical depression on November 17 to a typhoon on November 18, 2015. Rainfall from GPM's Microwave Imager (GMI) and Dual-Frequency Precipitation Radar (DPR) instruments were used to analyze the rainfall around typhoon IN-FA. GPM's DPR found that rain was falling at

Typhoon Koppu's Deadly Philippine Rainfall

Extremely heavy rainfall from super typhoon Koppu has caused deadly flooding and mudslides in the Philippines. Koppu hit the eastern coast of Luzon as a category four super typhoon with winds of 130kts (150 mph). Koppu weakened but was still battering the Philippines as a typhoon after reaching the Lingayen Gulf on Luzon's western coast. Typhoon Koppu then made a turn toward the north and continued to drench the northern Philippines as it followed Luzon's northwestern coast. Torrents of rain flowing from mountainous terrain magnified the effects of very high rainfall totals. A rainfall

GPM Reveals Very Strong Thunderstorms in Typhoon Choi-Wan

The GPM core observatory satellite flew above tropical storm Choi-Wan on October 5, 2015 at 1828 UTC and then saw Choi-Wan again as a hurricane on October 6, 2015 at 0448 UTC. The tropical cyclone was spreading clouds and rain over a large area of the northwest Pacific Ocean southeast of Japan. GPM discovered that Choi-Wan's organization had slightly improved. GPM's Microwave Imager (GMI) and Dual-Frequency Precipitation Radar (DPR) instruments were able to peer through the overcast and reveal the locations of rainfall bands within the tropical cyclone. GMI found several areas where Choi-Wan