tropical cyclones

IMERG rainfall totals from Cyclone Freddy
Tropical Cyclone Freddy first made landfall along the east coast of Madagascar just north of the town of Mananjary on Feb. 21, 2023, as a Category 3 cyclone with average winds reported at ~81 mph (130 km/h) and gusts up to ~112 mph (180 km/h). After crossing over Madagascar Freddy continued westward over the Mozambique Channel before making landfall again along the east coast of Mozambique just south of Vilankulos as a moderate tropical storm with sustained winds estimated at 50 mph. Despite being weaker at landfall, Freddy caused widespread flooding across parts of Mozambique due to the storm stalling out near the coast after making landfall. Incredibly, Freddy drifted back out over the Mozambique Channel, nearly making landfall along the southwest coast of Madagascar. It then changed direction, re-intensified, weakened, re-intensified one last time, and made landfall once again on March 11 near Quelimane, Mozambique, as a Category 1 cyclone with sustained winds reported at 90 mph.
IMERG Rainfall Totals from Cyclone Tauktae
NASA combined data from multiple satellites in the GPM Constellation to estimate precipitation rates and totals from Tropical Cyclone Tauktae in May 2021. The below animation shows precipitation rates (blue/yellow shading) and accumulations (green shading) at half-hourly intervals from May 12-19, 2021, derived from NASA's IMERG algorithm. Underneath the precipitation data, cloud cover is shown in shades of white/gray based on geosynchronous satellite infrared observations. On top of the precipitation data, the cyclone's approximate track is displayed based on estimates from the Joint Typhoon
IMERG Captures Rainfall from Tropical Cyclone Ana in Fiji
NASA combined data from multiple satellites to estimate the rainfall from Tropical Cyclone Ana in the Southwest Pacific Ocean amid an ongoing Madden-Julian Oscillation (MJO) event. The Madden-Julian Oscillation is a 20 to 90 day pattern of alternating wet and dry conditions that often begins in the tropical Indian Ocean and moves eastward into the Pacific. This animation shows rainfall rates (blue/yellow shading) and rainfall accumulations (green shading) at half-hourly intervals from January 26 - February 2, 2021, using NASA's IMERG algorithm, overlaid on shades of white/gray from NOAA

GPM Flies Over Developing Tropical Storm Idai Twice

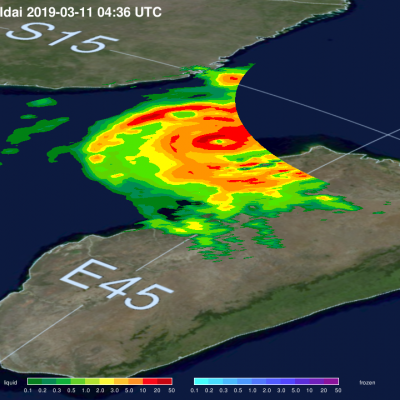
Intense Tropical Cyclone Idai started as a tropical depression on the 4th of March, 2019, off the coast of Mozambique. After making landfall over Mozambique it turned back over the Mozambique Channel and strengthened to become a tropical cyclone on the 10th of March. The GPM satellite captured the cyclone with both the GPM Microwave Imager (GMI) and the Dual-frequency Precipitation Radar (DPR) on the 11th of March at 04:36 UTC when the storm was in the middle on the Mozambique Channel. The DPR captured a well-developed eye, seen at the center of the image. It flew over the storm once again at

GPM Examines Weakening Tropical Cyclone Kenanga

Tropical cyclone Kenanga has started to weaken as predicted. The GPM core observatory satellite had an excellent view of Kenanga on December 20, 2018 at 1454 UTC when the tropical cyclone's maximum sustained winds had decreased to about 90 kts (103.5 mph). That GPM pass also showed that the eye that was so prominent a day earlier had filled. Data collected by the satellite's Microwave Imager (GMI) and GPM's Dual-Frequency Precipitation Radar (DPR) instruments revealed through the overcast that powerful storms south of Kenanga's center of circulation were still producing very heavy rainfall

Tropical Cyclone Gaja's Rainfall Measured With IMERG

Tropical cyclone Gaja recently caused the deaths of at least 33 people in the southern India state of Tamil Nadu. Gaja's high wind and heavy rains caused landslides and building collapses. Gaja's maximum sustained winds had reached about 75kts (86 mph) when it hit southern India on Friday November 16, 2018. This meant that Gaja was the equivalent of a category one on the Saffir-Simpson hurricane wind scale. Today another tropical low is also moving over southern India and is expected to produce more heavy rainfall in the same area. NASA's Integrated Multi-satellitE Retrievals for GPM (IMERG)

GPM Scans Tropical Storm Nadine

Tropical Depression fifteen was located southwest of the Cabo Verde Islands when it became tropical storm Nadine early on October 9, 2018. The GPM core observatory collected significant information about Nadine when it scanned the tropical storm's center of circulation on October 10, 2018 at 3:01 AM EDT (0701 UTC). Nadine was a small tropical storm but GPM's Microwave Imager (GMI) and Dual-Frequency Precipitation Radar (DPR) data revealed that extreme rainfall was occurring in areas around the center of the tropical cyclone. GPM's radar (DPR Ku Band) measurements indicated that rain was
GPM Flies Over Tropical Cyclone Florence
Download in High Resolution from the NASA Goddard Scientific Visualization Studio GPM passed over Tropical Storm Florence on September 7, 2018. As the camera moves in on the storm, DPR's volumetric view of the storm is revealed. A slicing plane moves across the volume to display precipitation rates throughout the storm. Shades of green to red represent liquid precipitation. Frozen precipitation is shown in cyan and purple. NASA's Global Precipitation Measurement mission or GPM core observatory satellite flew over Tropical Storm Florence on September 7, 2018. At that time, the storm was...

GPM Sees Tropical Cyclone Jebi Threaten Japan

Japan has been afflicted by several tropical cyclones and other extreme weather this summer. The Joint Typhoon Warning Center (JTWC) predicts that yet another typhoon called JEBI will be approaching the main islands of Japan early next week. Warm ocean temperatures and low vertical wind shear are providing a favorable environment for JEBI's intensification. The JTWC predicts that the typhoon will have peak sustained winds of 115 kts (132 mph) as it moves over the northern Pacific Ocean toward Japan next week. The GPM core observatory satellite passed above on August 28, 2018 at 1816 UTC when

Tropical Cyclone Mekunu Examined With GPM Satellite

The second tropical cyclone in less than a week has formed in the western Arabian Sea early on May 22, 2018. This tropical cyclone called MEKUNU is intensifying as it heads toward Oman. The Joint Typhoon Warning Center (JTWC) predicts that MEKUNU will have winds of about 85 kts (98 mph) when it hits southwestern Oman in about three days. This will make it the equivalent of a category two hurricane on the Saffir-Simpson hurricane wind scale. Tropical cyclone MEKUNU follows on the heels of destructive and deadly tropical cyclone SAGAR that just made landfall over northwestern Somalia a few days