Songda

GPM Looks at Rainfall in Remnants of Songda Over Pacific NW

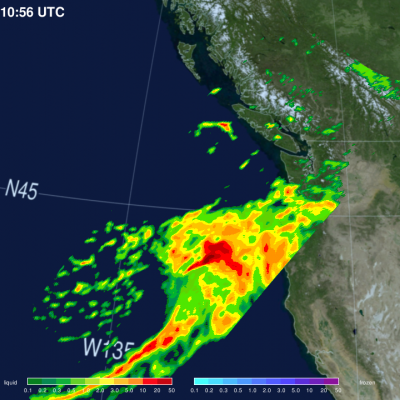
The Global Precipitation Measurement mission or GPM core satellite saw heavy rain with rates of around 50 mm/hr (~2 inches/hr shown in dark red) in the front that absorbed the remnants of former northwestern Pacific Ocean Typhoon Songda. These images were created from data taken on Saturday, Oct. 15 as the front was affecting the U.S. Pacific Northwest. The rain is depicted in red and green areas, indicating heavy, moderate and light rain, respectively. Images produced by Jacob Reed (Telophase/NASA GSFC) and caption by Rob Gutro (GSFC)

Japan gets Heaviest Rainfall from Songda

The TRMM-based, near-real time Multi-satellite Precipitation Analysis (TMPA) at the NASA Goddard Space Flight Center was used in the analysis above to show the total rainfall that occurred when super typhoon Songda was active in the western Pacific Ocean. TMPA rainfall totals are shown here for the period from 23 May to 31 May 2011. The rainfall analysis indicated that the highest rainfall totals of over 300mm (~11.8 inches) occurred in the Pacific east of the Philippines. The highest rainfall totals over land fell in the islands of southern Japan even though Songda had by then weakened to a

Songda Passes Northeast of the Phillippines

Super Typhoon Songda was seen again by the TRMM satellite on 27 May 2011 at 0710 UTC. The TRMM satellite view shows that powerful super typhoon Songda contained bands of extremely heavy rainfall with numerous powerful thunderstorms. Songda is predicted to pass to the east of Taiwan and weaken over the next few days. Bands of rainfall from the weakening storm may move over Japan as the predicted center brushes the south-eastern coastline from 29-30 May 2011.

Songda becomes a Super Typhoon

As predicted, Typhoon Songda intensified and was a super typhoon with wind speeds estimated at over 130 kts ( ~145 mph) when the TRMM satellite passed directly over head on 26 May 2011 at 0806 UTC. The image above used data from TRMM's Visible and InfraRed Scanner (VIRS) and a TRMM rainfall analysis . The rainfall analysis from TRMM's Microwave Imager (TMI) and Precipitation Radar (PR) data shows that Songda had a circular eye with extremely heavy rainfall, particularly in the southeast quadrant. TRMM's PR data shows the concentric rain bands typical of powerful typhoons. Below is a simulated

Tropical Storm Four Forms in the Pacific

The TRMM satellite flew over rapidly forming TS04W in the western Pacific on 20 May 2011 at 0037 UTC (~10:37 AM LOCAL TIME). This daylight TRMM pass showed that the tropical cyclone was becoming much better organized. The intensifying tropical cyclone now contained several areas of heavy thunderstorms dropping rain at over 50 mm/hour (~2 inches/hour). The 3-D perspective image on the upper right shows the storm's vertical structure. TRMM's Precipitation Radar (PR) now showed that some thunderstorm towers near the center of circulation were punching up to heights of over 16 km (~9.9 miles)