DPR

GPM Sees Weekend Texas Tornadoes

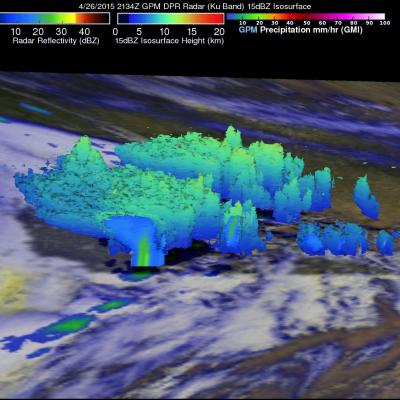
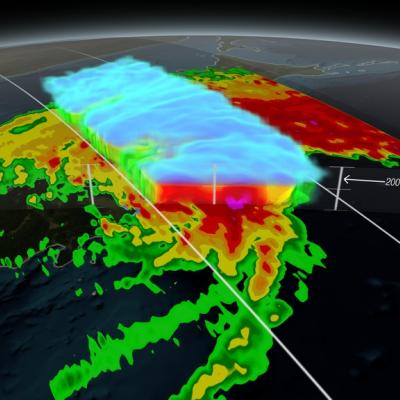
Stormy spring weather over the Southwest popping up during the past weekend with at least twenty tornadoes sightings over Texas on Sunday April 26, 2015. The GPM core Observatory satellite had a good view of severe storms developing yesterday through central Texas when it flew over at 2134 UTC (4:42 PM CDT). Large hail and heavy rainfall was associated with some of these storms. This image shows a 3-D view of severe weather over Texas using data from the first space-borne Ku/Ka-band Dual-frequency Precipitation Radar (DPR) on board the GPM Core Observatory satellite. Ku Band radar from this

GPM Looks Into Cyclone Joalane's Eye

Cyclone Joalane had developed a small clear eye when the GPM core observatory satellite passed above on April 7, 2015 at 1436 UTC. GPM's Microwave Imager (GMI) data showed that the heaviest rain was falling at a rate of over 78.6 mm (3 inches) per hour in a feeder band wrapping around Joalane's eastern side. This simulated 3-D flyby around Joalane was made using data from the Ku band on GPM's dual frequency radar. Those radar data discovered that the intense thunderstorms, reaching heights above 16 km (9.9 miles), were located where the heaviest rainfall was measured by GPM's GMI.
3D Views of February Snow Storms from GPM
Download this video in HD formats from NASA Goddard's Scientific Visualization Studio The Global Precipitation Measurement (GPM) Core Observatory captured a 3-D image of a winter storm on Feb. 17, 2015, that left 6 to 12 inches of snow over much of Kentucky, southwestern West Virginia and northwestern North Carolina. The shades of blue indicate rates of snowfall, with more intense snowfall shown in darker blue. Intense rainfall is shown in red. The imagery shows great variation in precipitation types over the southeastern United States. Download this video in HD formats from NASA Goddard's...

Initial IMERG Products Released

PPS is re-releasing the first public version IMERG products The Integrated Multi-satellitE Retrievals for GPM (IMERG) merges precipitation estimates from passive microwave sensors, geo-IR, and monthly surface precipitation gauge analysis data (where available) to provide half-hourly and monthly precipitation estimates and related fields on a 0.1° lat./long. grid over the domain 60°N-S. The current period of record is mid-March 2014 to the present (delayed by about 3 months) .Please refer to the IMERG Release notes , the technical IMERG document and the IMERG Algorithm Theoretical Basis

Tropical Depression Mekkhala Organizes

Tropical Depression 01W, in the western Pacific Ocean, has been given the name Mekkhala. The tropical cyclone has become much better organized and the Joint Typhoon Warning Center (JTWC) predicts that tropical storm Mekkhala will affect the eastern Philippines in a few days. The GPM (core satellite) flew above Mekkhala on January 14, 2015 at 1043 UTC. GPM's Microwave Imager (GMI) instrument observed rain falling at a rate of over 71.63 mm (about 2.8 inches) per hour in intense convective storms near the tropical cyclone's center. This 3-D view was derived from data collected by GPM's Radar (Ku
GPM Scans Typhoon Phanfone
Animation revealing a swath of GPM/GMI precipitation rates over Typhoon Phanfone. The camera then moves down closer to the storm to reveal DPR's volumetric view of Phanphone. A slicing plane dissects the Typhoon from south to north and back again, revealing it's inner precipitation rates. Shades of blue indicate frozen precipitation (in the upper atmosphere). Shades of green to red are liquid precipitation which extend down to the ground. Download in Hi-Res from the Scientific Visualization Studio On October 6, 2014 (0215 UTC) the Global Precipitation Measurement (GPM) mission's Core...

GPM Data Goes Public

The most accurate and comprehensive collection of rain, snowfall and other types of precipitation data ever assembled now is available to the public. This new resource for climate studies, weather forecasting, and other applications is based on observations by the Global Precipitation Measurement (GPM) Core Observatory, a joint mission of NASA and the Japan Aerospace Exploration Agency (JAXA), with contributions from a constellation of international partner satellites. The GPM Core Observatory, launched from Japan on Feb. 27, carries two advanced instruments to measure rainfall, snowfall, ice
PMM Article Image
On September 26, the Global Precipitation Measurement (GPM) satellite flew over an extra-tropical cyclone whose center was approaching Norway. The Norwegian weather service reported that this storm brought gale-force winds to parts of Norway's coast and mountains (20 m/s in the mountains and 50 m/s just off-coast, late at night on September 26). Extra-tropical cyclones this strong or stronger are a regular feature of northern European winters. The particularly damaging ones are called "windstorms." Borrowing a page from hurricane forecasters, some weather agencies in affected countries name...
GPM Data from March 2014 East Coast Snowstorm
Video Embed

JacobAdmin Thu, 09/04/2014

One of the first storms observed by the NASA/JAXA GPM Core Observatory on March 17, 2014, in the eastern United States revealed a full range of precipitation, from rain to snow.

Learn More

Download this video in HD formats from NASA Goddard's Scientific Visualization Studio

GPM Data from a March 2014 Snostorm
Image Credit: NASA's Goddard Space Flight Center Download this video in HD formats from NASA Goddard's Scientific Visualization Studio The most accurate and comprehensive collection of rain, snowfall and other types of precipitation data ever assembled now is available to the public. This new resource for climate studies, weather forecasting, and other applications is based on observations by the Global Precipitation Measurement (GPM) Core Observatory, a joint mission of NASA and the Japan Aerospace Exploration Agency (JAXA), with contributions from a constellation of international partner...