Barry

Hurricane Barry Makes Landfall in Louisiana

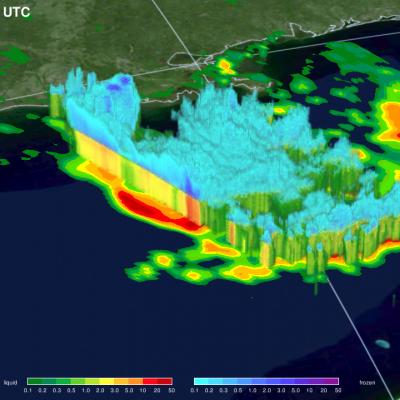
UPDATE 7/17/19: This GPM IMERG animation shows rainfall accumulations from #HurricaneBarry in the Gulf of Mexico from July 11-16, 2019. Learn more: https://t.co/1QjFLDbD0k pic.twitter.com/CC7J0AsSTW — NASA Precipitation (@NASARain) July 17, 2019 This 6-day animation shows the heavy precipitation that Hurricane Barry (2019) producing from July 11 to 16 in the Gulf of Mexico and the South Central U.S. While forecasters were initially concerned that the largest accumulations would extend far over land, this animation shows that the largest accumulations remained mostly off shore. The

GPM Sees Developing Tropical Storm Barry in the Gulf of Mexico

NASA / JAXA’s GPM Core Observatory passed over developing Tropical Depression 2 (which was upgraded to Tropical Storm Barry later in the morning) in the Gulf of Mexico the morning of July 11th 2019 at 8:26am CT, capturing estimates of rainfall rates within the storm. The first image shows rainfall rates collected by GPM’s Microwave Imager, while the second image shows 3D rainfall rates within the atmospheric column from GPM’s Dual-frequency Precipitation Radar (DPR). The DPR measured storm top heights as high as 18 km, which is extremely high and indicative of intense thunderstorm activity

Tropical Storm Barry Forms & Makes Second Landfall

As predicted by the National Hurricane Center (NHC), tropical depression two strengthened in the Bay Of Campeche and became tropical storm Barry on Wednesday June 19, 2013 at 1:45 PM CDT (18:45 UTC). Barry's center of circulation made landfall today just north of Veracruz, Mexico between 1200 and 1300 UTC with 40kt(~46 mph) winds. The NHC has forecast that heavy rainfall from Barry "could cause life-threatening flash flooding and mud slides..." This image uses data captured when the TRMM satellite had a good view of tropical storm Barry on June 20, 2013 at 1510 UTC (10:10 AM CDT). A rainfall