NASA Aids Response to Carolina Flooding
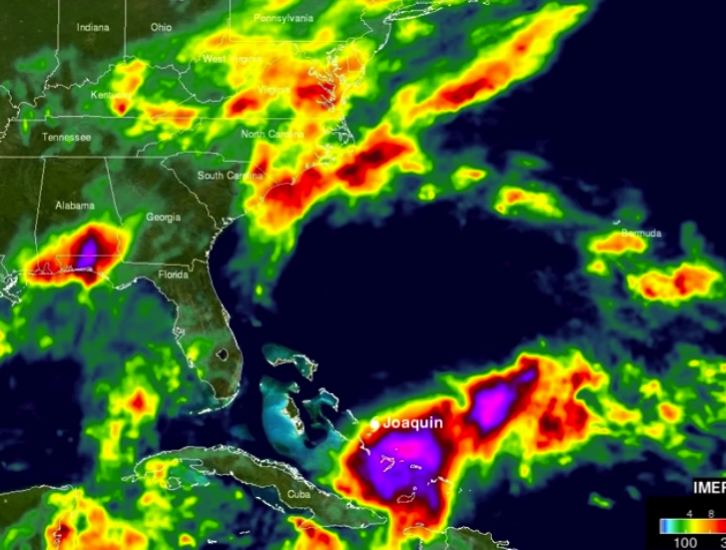
It was rain that wouldn't quit. A weather system fueled by warm moisture streaming in from the Atlantic Ocean on Oct. 3 and 4 relentlessly dumped between one and two feet of rain across most of South Carolina. The result was rivers topping their banks and dams bursting. Catastrophic flooding followed across most of the state, which has left residents in some areas without power or clean drinking water.
Tracking and predicting the deluge, both as rain and then floodwater, are the first steps to help protect people in harm's way. State and federal emergency managers have been on the front lines of this natural disaster since it began, armed with weather and flood forecasts from the National Weather Service. NASA has supported these efforts with information based on data from Earth-observing satellites in space.
Credits: SSAI/NASA/JAXA, Hal Pierce
The Global Precipitation Measurement, or GPM, mission, a joint project of NASA and the Japan Aerospace Exploration Agency (JAXA), provided regular data on the amount of rain falling across the region. The GPM Core Observatory, launched in 2014, combines data with a network of international partner satellites that together provide updated rainfall estimates every three hours. These data, managed by NASA's Goddard Space Flight Center in Greenbelt, Maryland, confirmed the record-breaking rainfall totals and fed into other systems that helped forecast the extent of the flooding in the region.

Relative soil moisture over the Carolinas on Oct. 5, 2015, shown in percent. Green indicates the soils are 50 to 65 percent saturated, while blues and purples indicate 65 to 100 percent saturated. Saturated soils can hold no more water so those areas will flood.
Credits: NASA's Marshall Space Flight Center
Equally essential as following the rain is knowing what happens when it reaches the ground. The NASA Short-term Prediction Research and Transition Center, or SPoRT, at Marshall Space Flight Center in Huntsville, Alabama, runs a computer simulation model called the NASA Land Information System for most of the central and eastern United States, including the Carolinas. The SPoRT Project used rainfall data from the GPM mission and measurements from NASA’s Soil Moisture Active Passive satellite in this near real-time simulation, and provided the National Weather Service (NWS) forecast offices with experimental soil moisture data that can aid short-term flood forecasting. Soil moisture describes the ability of the ground to absorb water, like a sponge. During the record setting rainfall event, soil moisture across South Carolina reached 75 to100 percent saturation. At these high levels of saturation, the soil no longer has the sponge capacity to hold the water, so it flows over the land – leading to flash floods.

The Global Flood Monitoring maps for Oct. 5 and 6 show where rivers and land surfaces are likely to see flooding. The flood water height is shown in colors corresponding to millimeters above the flood threshold.
Credits: GFMS/University of Maryland
GPM rainfall data is used in another NASA-funded flood prediction tool that follows water on the ground, the Global Flood Monitoring System, developed and run by researchers at the University of Maryland. The Global Flood Monitoring system takes current satellite rain data and combines it with a model of the land surface – showing slopes, streams, and rivers – and soil moisture to project the likelihood of flooding based on when rivers broke their banks in the past. The Federal Emergency Management Agency (FEMA) and the Department of Homeland Security use these maps to help tell where the flooding is now, after the rainfall, and where flooding may continue in the days ahead as floodwaters move downstream.
Even before the storm clouds cleared, efforts to assess the damage from space had begun. NASA's Advanced Rapid Imaging and Analysis project at the Jet Propulsion Laboratory in Pasadena, California, developed plans to analyze before-and-after data from synthetic aperture radars (SAR) flown by the Italian Space Agency and JAXA. This data can see through clouds to detect changes in the urban environment, such as storm damage to buildings and roads.
NASA uses the vantage point of space to increase our understanding of our home planet, improve lives, and safeguard our future. NASA develops new ways to observe and study Earth's interconnected natural systems with long-term data records. The agency freely shares this unique knowledge and works with institutions around the world to gain new insights into how our planet is changing.
For more on how NASA Earth science benefits people around the world, visit:

