

GPM Dissects Super Typhoon Hagupit
On December 5, 2014 (1032UTC) the Global Precipitation Measurement (GPM) mission's Core Observatory flew over Typhoon Hagupit as it headed towards the Philippines. A few hours later at 1500 UTC (10 a.m. EST), Super Typhoon Hagupit's maximum sustained winds were near 130 knots (149.6 mph/241 kph), down from 150 knots (172 mph/277.8 kph). Typhoon-force winds extend out 40 nautical miles (46 miles/74 km) from the center, while tropical-storm-force winds extend out to 120 miles (138 miles/222 km).


Animation revealing a swath of GPM/GMI precipitation rates over Typhoon Hagupit. As the camera moves in on the storm, DPR's volumetric view of the storm is revealed. A slicing plane moves across the volume to display precipitation rates throughout the storm. Shades of green to red represent liquid precipitation extending down to the ground.
The GPM Core Observatory carries two instruments that show the location and intensity of rain and snow, which defines a crucial part of the storm structure – and how it will behave. The GPM Microwave Imager sees through the tops of clouds to observe how much and where precipitation occurs, and the Dual-frequency Precipitation Radar observes precise details of precipitation in 3-dimensions.
For forecasters, GPM's microwave and radar data are part of the toolbox of satellite data, including other low Earth orbit and geostationary satellites, that they use to monitor tropical cyclones and hurricanes.
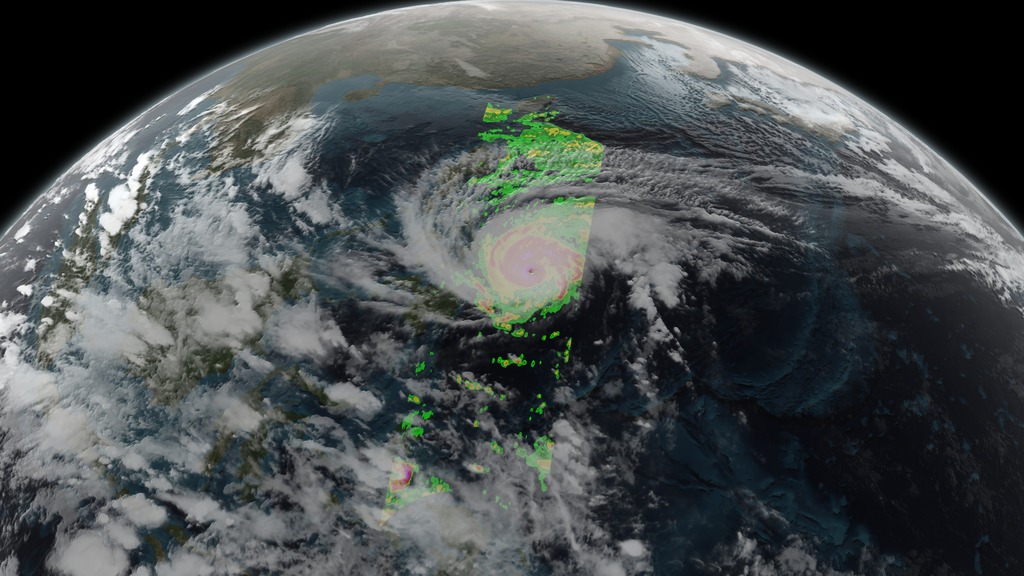 This image shows GPM's pass over Typhoon Hagupit and precipitation over the western Pacific Ocean on December 5th, 2014.
The addition of GPM data to the current suite of satellite data is timely. Its predecessor precipitation satellite, the Tropical Rainfall Measuring Mission, is 18 years into what was originally a three-year mission. GPM's new high-resolution microwave imager data and the unique radar data ensure that forecasters and modelers won't have a gap in coverage. GPM is a joint mission between NASA and the Japan Aerospace Exploration Agency. All GPM data products can be found at NASA Goddard's Precipitation Processing Center website http://pps.gsfc.nasa.gov/.